 1 """
 2 #演示内容:二次回归和线性回归的拟合效果的对比
 3 """
 4 print(__doc__)
 5
 6 import numpy as np
 7 import matplotlib.pyplot as plt
 8 from sklearn.linear_model import LinearRegression
 9 from sklearn.preprocessing import PolynomialFeatures
10 from matplotlib.font_manager import FontProperties
11 font_set = FontProperties(fname=r"c:windowsfontssimsun.ttc", size=20)
12
13 def runplt():
14     plt.figure()# 定义figure
15     plt.title(u'披萨的价格和直径',fontproperties=font_set)
16     plt.xlabel(u'直径(inch)',fontproperties=font_set)
17     plt.ylabel(u'价格(美元)',fontproperties=font_set)
18     plt.axis([0, 25, 0, 25])
19     plt.grid(True)
20     return plt
21
22
23 #训练集和测试集数据
24 X_train = [[6], [8], [10], [14], [18]]
25 y_train = [[7], [9], [13], [17.5], [18]]
26 X_test = [[7], [9], [11], [15]]
27 y_test = [[8], [12], [15], [18]]
28
29 #画出横纵坐标以及若干散点图
30 plt1 = runplt()
31 plt1.scatter(X_train, y_train,s=40)
32
33 #给出一些点,并画出线性回归的曲线
34 xx = np.linspace(0, 26, 5)
35 regressor = LinearRegression()
36 regressor.fit(X_train, y_train)
37 yy = regressor.predict(xx.reshape(xx.shape[0], 1))
38
39 plt.plot(xx, yy, label="linear equation")
40
41 #多项式回归(本例中为二次回归)
42 #首先生成多项式特征
43 quadratic_featurizer = PolynomialFeatures(degree=2)
44 X_train_quadratic = quadratic_featurizer.fit_transform(X_train)
45
46 regressor_quadratic = LinearRegression()
47 regressor_quadratic.fit(X_train_quadratic, y_train)
48
49 #numpy.reshape(重塑)给数组一个新的形状而不改变其数据。在指定的间隔内返回均匀间隔的数字
50 #给出一些点,并画出线性回归的曲线
51 xx = np.linspace(0, 26, 100)
52 print (xx.shape)         #(100,)
53 print (xx.shape[0])      #100
54 xx_quadratic = quadratic_featurizer.transform(xx.reshape(xx.shape[0], 1))
55 print (xx.reshape(xx.shape[0], 1).shape)       #(100,1)
56
57 plt.plot(xx, regressor_quadratic.predict(xx_quadratic), 'r-',label="quadratic equation")
58 plt.legend(loc='upper left')
59 plt.show()
60
61 X_test_quadratic = quadratic_featurizer.transform(X_test)
62 print('linear equation  r-squared', regressor.score(X_test, y_test))
63 print('quadratic equation r-squared', regressor_quadratic.score(X_test_quadratic, y_test))
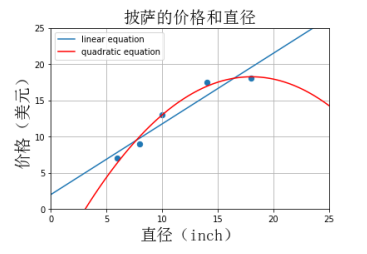
linear equation r-squared 0.8283656795834485
quadratic equation r-squared 0.9785451046983036
二次回归的拟合效果更好。