import requests, json
from pyecharts.charts import Map, Page, Pie, Bar
from pyecharts import options as opts
from pyecharts.globals import ThemeType


def chinaTotal():
    re = requests.get(
        "https://view.inews.qq.com/g2/getOnsInfo?name=disease_h5&callback=jQuery341045890055561903065_1592206473904&_=1592206473905")
    data = str(re.text)[42:-1]
    data = json.loads(data)
    data = json.loads(data["data"])
    print(data["chinaTotal"])
    data = data["chinaTotal"]
    confirm = data["confirm"]
    heal = data["heal"]
    dead = data["dead"]
    nowConfirm = data["nowConfirm"]
    suspect = data["suspect"]
    nowSevere = data["nowSevere"]
    importedCase = data["importedCase"]
    noInfect = data["noInfect"]
    print(
        "confirm:" + str(confirm) + "
"
                                    "heal:" + str(heal) + "
"
                                                          "dead:" + str(dead) + "
"
                                                                                "nowConfirm:" + str(nowConfirm) + "
"
                                                                                                                  "suspect:" + str(
            suspect) + "
"
                       "nowSevere:" + str(nowSevere) + "
"
                                                       "importedCase:" + str(importedCase) + "
"
                                                                                             "noInfect:" + str(
            noInfect) + "

"
    )


def areatotal():
    global province_distribution
    re = requests.get(
        "https://view.inews.qq.com/g2/getOnsInfo?name=disease_h5&callback=jQuery341045890055561903065_1592206473904&_=1592206473905")
    data = str(re.text)[42:-1]
    data = json.loads(data)
    data = data["data"]
    data = json.loads(data)
    data = data["areaTree"]
    data = data[0]
    data = data["children"]
    print(data)
    for i in data:
        temp = []
        areaname = str(i["name"])
        nowConfirm = str(i["total"]["nowConfirm"])
        confirm = str(i["total"]["confirm"])
        suspect = str(i["total"]["suspect"])
        dead = str(i["total"]["dead"])
        deadRate = str(i["total"]["deadRate"])
        heal = str(i["total"]["heal"])
        healRate = str(i["total"]["healRate"])
        temp.append(areaname)
        temp.append(confirm)
        kv.append(temp)
        province_distribution[areaname] = province_distribution.get(areaname, confirm)
        print(
            "areaname:" + str(areaname) + "
"
                                          "nowConfirm:" + str(nowConfirm) + "
"
                                                                            "confirm:" + str(confirm) + "
"
                                                                                                        "suspect:" + str(
                suspect) + "
"
                           "dead:" + str(dead) + "
"
                                                 "deadRate:" + str(deadRate) + "
"
                                                                               "heal:" + str(heal) + "
"
                                                                                                     "healRate:" + str(
                healRate) + "

"

        )


def initMap():
    map = Map()
    map.set_global_opts(
        title_opts=opts.TitleOpts(title="中国疫情地图"),
        visualmap_opts=opts.VisualMapOpts(max_=3600, is_piecewise=True,
                                          pieces=[
                                              {"max": 100000, "min": 10001, "label": ">10000", "color": "#680606"},
                                              {"max": 10000, "min": 5001, "label": "5001-10000", "color": "#8A0808"},
                                              {"max": 5000, "min": 1001, "label": "1001-5000", "color": "#B40404"},
                                              {"max": 1000, "min": 600, "label": "600-1000", "color": "#DF0101"},
                                              {"max": 599, "min": 100, "label": "100-599", "color": "#F78181"},
                                              {"max": 99, "min": 1, "label": "1-99", "color": "#F5A9A9"},
                                              {"max": 0, "min": 0, "label": "0", "color": "#FFFFFF"},
                                          ], )  # 最大数据范围,分段
    )
    pie = (
        Pie()

            .add("", kv, center=["50%", "80%"], radius=[30, 100])  # 加入数据
            .set_global_opts(title_opts=opts.TitleOpts(title="疫情统计饼图"),
                             legend_opts=opts.LegendOpts(pos_left=160))  # 全局设置项
            .set_series_opts(label_opts=opts.LabelOpts(formatter="{b}: {c}")))  # 样式设置项
    # V1 版本开始支持链式调用
    # 你所看到的格式其实是 `black` 格式化以后的效果
    # 可以执行 `pip install black` 下载使用
    # Bar是柱状图/条形图

    # 不习惯链式调用的开发者依旧可以单独调用方法
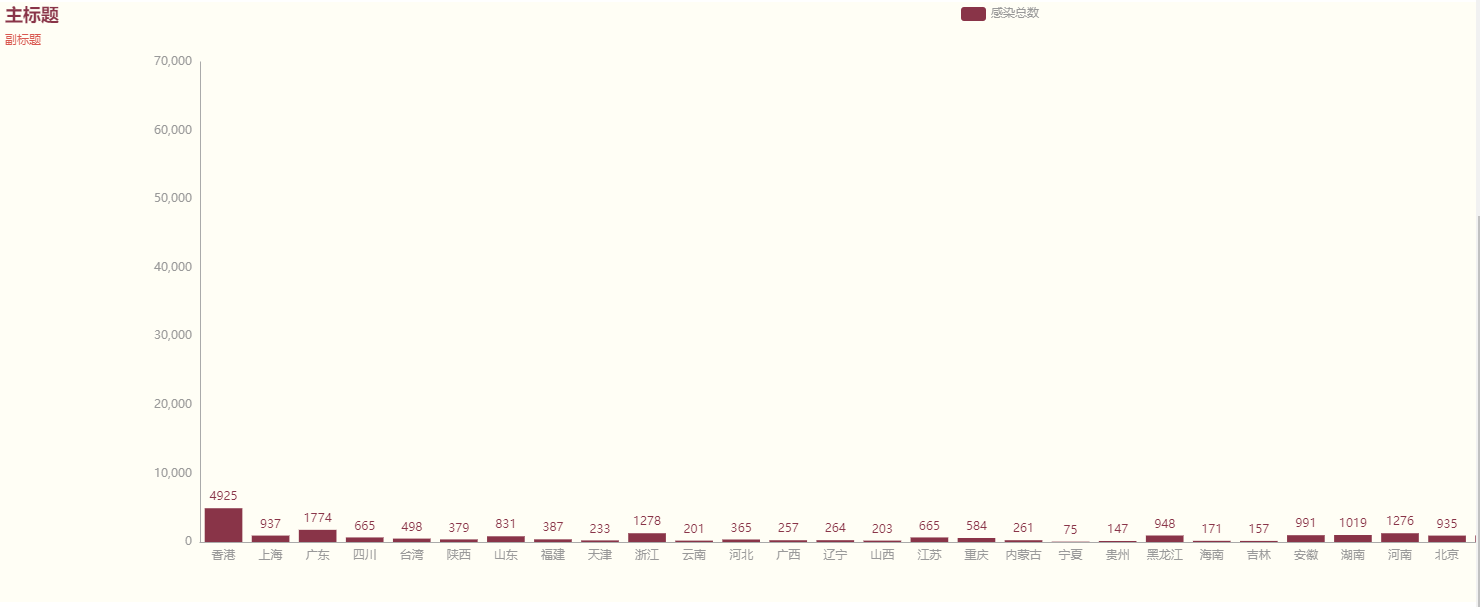
    bar = Bar(init_opts=opts.InitOpts(bg_color='rgba(255,250,205,0.2)',
                                      width='2000px',
                                      height='600px',
                                      page_title='page',
                                      theme=ThemeType.ESSOS
                                      ))
    bar.add_xaxis(xaxis_data=list(province_distribution.keys()))
    bar.add_yaxis("感染总数", list(province_distribution.values()))
    bar.set_global_opts(title_opts=opts.TitleOpts(title="主标题", subtitle="副标题"))
    bar.set_series_opts(markpoint_opts=opts.MarkPointOpts(
        data=[opts.MarkPointItem(type_='max', name='最大值'), opts.MarkPointItem(type_='min', name='最小值')]))
    bar.render(r"testBar.html")
    map.add("中国疫情地图", data_pair=province_distribution.items(), maptype="china", is_roam=True)
    page.add(map)
    page.add(pie)
    page.add(bar)


if __name__ == '__main__':
    province_distribution = {}
    kv = []
    chinaTotal()
    areatotal()
    page = Page()
    initMap()
    print(province_distribution)
    page.render('中国疫情地图.html')


