注:本文是人工智能研究网的学习笔记
ROC是什么
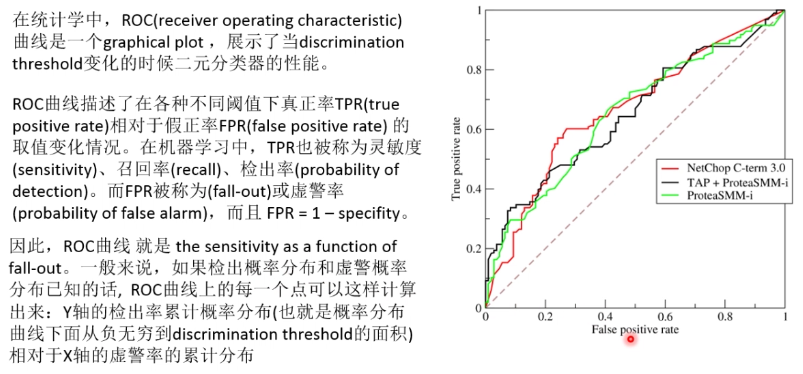
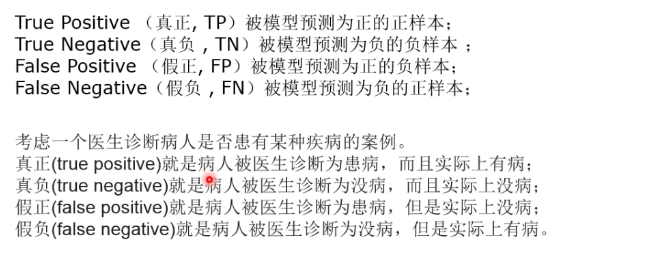
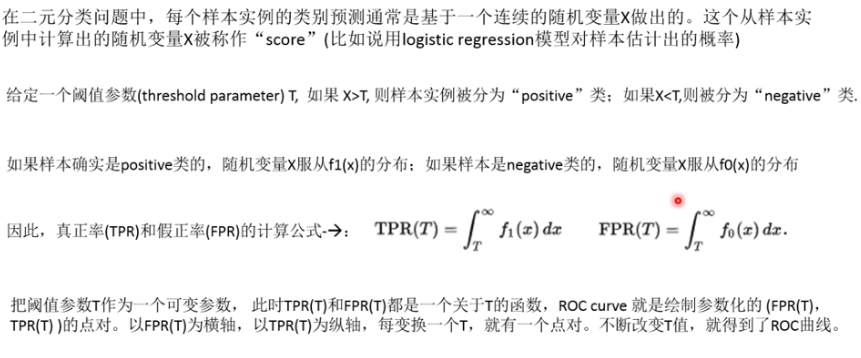
二元分类器(binary classifier)的分类结果
ROC空间
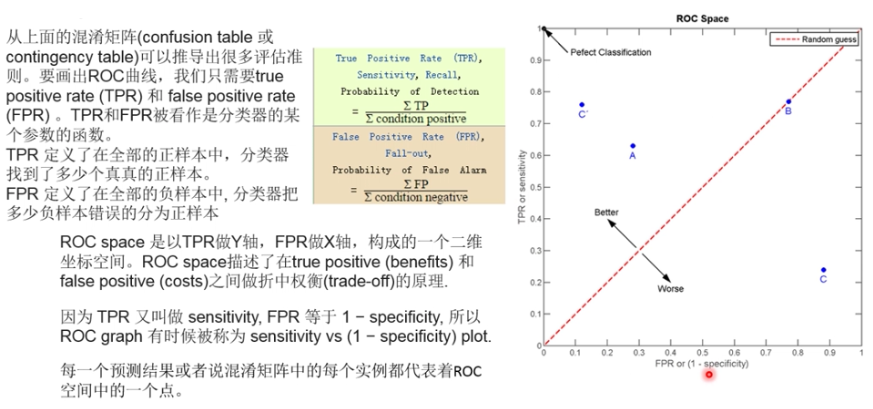
最好的预测模型在左上角,代表100%的灵敏度和0%的虚警率,被称为完美分类器。
一个随机猜测模型。会给出从左下角到右上角的沿着对角线的点(对角线被称作line of no-discrimation)。
对角线上的的点代表了好的分配结果,对角线以下的点代表不好的分配结果,但是可以通过翻转变成好的分类器。
绘制ROC曲线

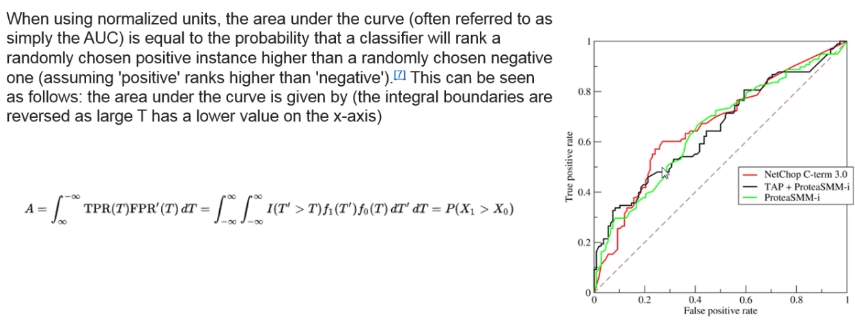
AUC--ROC曲线下的面积
当曲线差不多时,求面积, 新的研究表名,AUC曲线存在一些问题。
roc_curve模块
metrics.roc_curve(y_true, y_score, pos_label=None, sample_weight=None, drop_intermediate=True)
参数:
- y_true: 真正的二元类标签,如果不是二元分类,需要使用pos_label显式的指明。
- y_score: 预测得分
- pos_label: 多分类的时候,指定将哪一个看成正样本,默认是None。
- drop_intermediate: 指定是否丢弃一些次优的阈值,将不会再roc曲线上显示。曲线较多的时候,可以使用。
返回值:
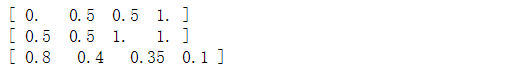
- fpr:array,shape=[>2]不断增长的虚警率(假正率)
- tpr:array,shape=[>2]不断增长的真正率
- thresholds:array,shape=[n_thresholds]阈值
from sklearn.metrics import roc_curve,roc_auc_score
y = np.array([1,1,2,2])
scores = np.array([0.1, 0.4, 0.35, 0.8])
fpr, tpr, thresholds = roc_curve(y, scores, pos_label=2)
print(fpr)
print(tpr)
print(thresholds)