Managing Performance
Objectives
After completing this lesson, you should be able to use:
• Enterprise Manager to monitor performance
• Automatic Memory Management (AMM)
• The Memory Advisor to size memory buffers
目标
完成本课程后,您应该能够使用:
•企业经理监控绩效
•自动内存管理(AMM)
•内存顾问调整内存缓冲区的大小
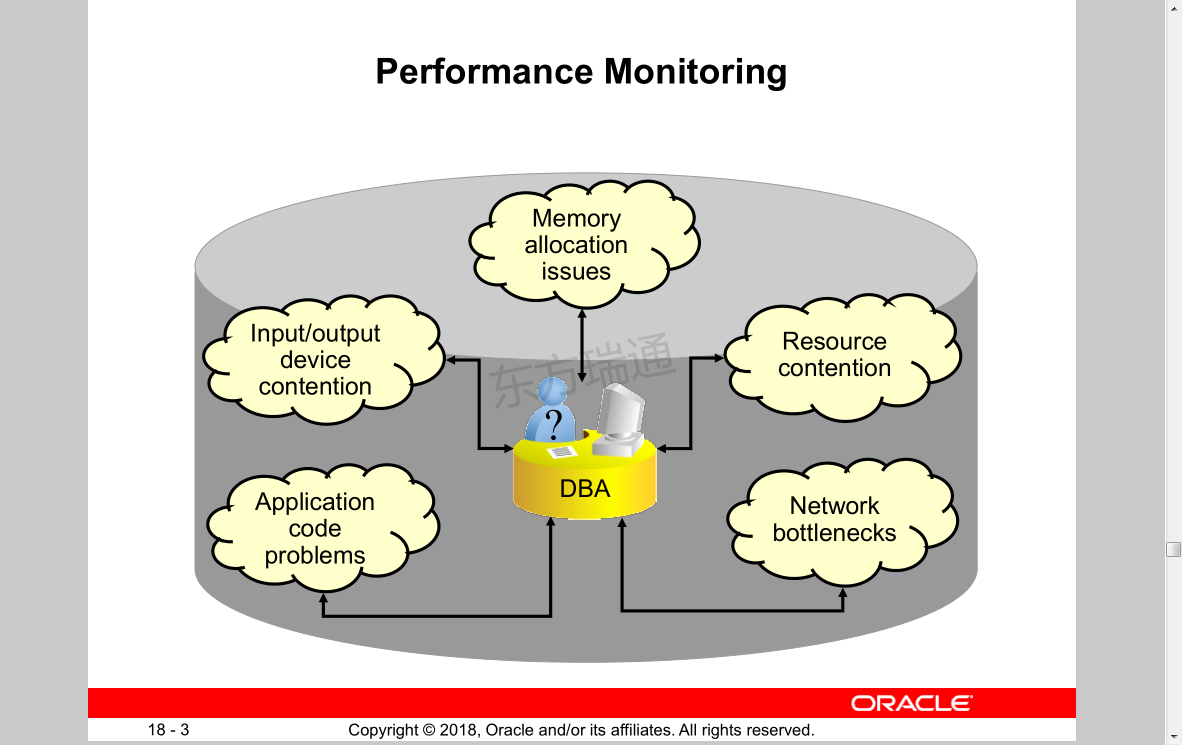
Performance Monitoring 性能监控
Memory allocation issues
Input/output device contention
Application code problems
Resource contention
Network bottlenecks
内存分配问题
输入/输出设备争用
应用程序代码问题
资源争用
网络瓶颈
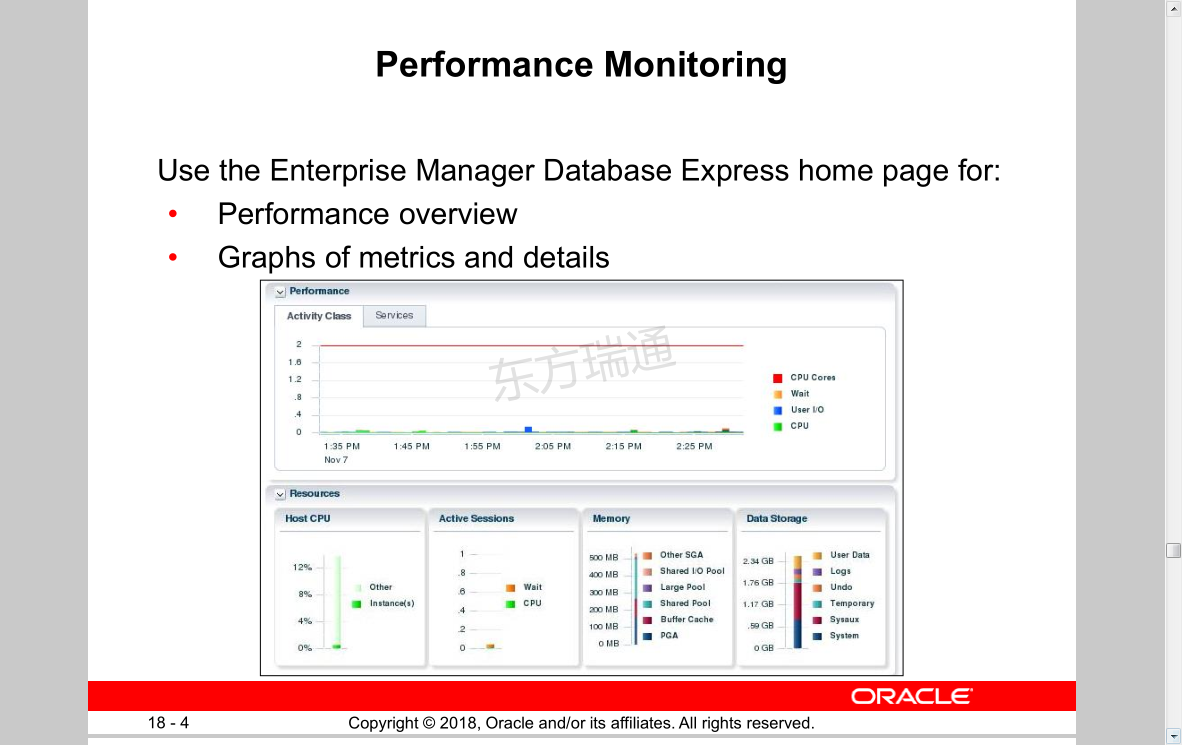
Performance Monitoring
Use the Enterprise Manager Database Express home page for:
• Performance overview
• Graphs of metrics and details
性能监控
将Enterprise Manager Database Express主页用于:
•性能概述
•指标和细节图表
Tuning Activities
The three activities in performance management are:
• Performance planning
• Instance tuning
• SQL tuning
调整活动
绩效管理的三项活动是:
•绩效规划
•实例调整
•SQL调整 重中之重
Performance Planning
• Investment options 预算
• System architecture 硬件
• Scalability
• Application design principles
• Workload testing, modeling, and implementation
• Deploying new applications
绩效计划
•投资选择
•系统架构
•可扩展性
•应用程序设计原则
•工作负载测试、建模和实施
•部署新应用程序
Instance Tuning
• Have well-defined goals.
• Allocate memory to database structures.
• Consider I/O requirements in each part of the database.
• Tune the operating system for optimal performance of the database.
实例调整
•有明确的目标。
•为数据库结构分配内存。
•考虑数据库每个部分的I/O要求。
•调整操作系统以获得数据库的最佳性能。
Performance Tuning Methodology
The tuning steps:
• Tune from the top down. Tune the:
1. Design 从代码开始
2. Application code 可通过ADDM日志查看耗费资源的语句
3. Instance 看实例的构建
• Tune the area with the greatest potential benefit. Identify and tune:
– SQL using the greatest resources
– The longest waits
– The largest service times
• Stop tuning when the goal is met.
性能调整方法
调整步骤:
•自上而下调谐。调整:
1设计
2应用程序代码
3实例
•调整具有最大潜在效益的区域。识别和调整:
–使用最大资源的SQL
–最长等待时间
–服务时间最长
•达到目标时停止调谐
Performance Tuning Data
Type of data gathered:
• Cumulative statistics:
– Wait events with time information
– Time model
• Metrics: Statistic rates
• Sampled statistics: Active session history
– Statistics by session
– Statistics by SQL
– Statistics by service
– Other dimensions
性能调整数据
收集的数据类型:
•累积统计:
–带有时间信息的等待事件
–时间模型
•指标:统计比率
•抽样统计:活动会话历史记录
–按时段统计
–按SQL统计
–按服务统计
–其他尺寸
Using the Enterprise Manager Database Express Performance Hub Page
Using the Enterprise Manager Cloud Control Performance Home Page
Monitoring Session Performance
Performance Monitoring: Top Sessions
Displaying Session-Related Statistics

Performance Monitoring: Top Services
Displaying Service-Related Statistics
For n-tier environments, because session statistics are not as helpful, you can see service-level statistics in these views:
• V$SERVICE_EVENT: Aggregated wait counts and wait times for each service, on a per-event basis
• V$SERVICE_WAIT_CLASS: Aggregated wait counts and wait times for each service on a wait-class basis
显示与服务相关的统计信息
对于n层环境,由于会话统计信息没有那么有用,您可以在以下视图中查看服务级别统计信息:
•V$SERVICE U EVENT:基于每个事件的每个服务的累计等待计数和等待时间
•V$SERVICE U WAIT U CLASS:基于等待类的每个服务的合计等待计数和等待时间
Viewing Wait Events 查看等待事件
Oracle Wait Events
• A collection of wait events provides information about the sessions or processes that had to wait or must wait for different reasons.
• These events are listed in the V$EVENT_NAME view.
SQL> select count(*) from v$enent_name; 会查看io等待与内存等待
SQL> show parameter cache
NAME_COL_PLUS_SHOW_PARAM
--------------------------------------------------------------------------------
TYPE
-----------
VALUE_COL_PLUS_SHOW_PARAM
--------------------------------------------------------------------------------
client_result_cache_lag
big integer
3000
client_result_cache_size
big integer
0
data_transfer_cache_size
NAME_COL_PLUS_SHOW_PARAM
--------------------------------------------------------------------------------
TYPE
-----------
VALUE_COL_PLUS_SHOW_PARAM
--------------------------------------------------------------------------------
big integer
0
db_16k_cache_size
big integer
0
db_2k_cache_size
big integer
NAME_COL_PLUS_SHOW_PARAM
--------------------------------------------------------------------------------
TYPE
-----------
VALUE_COL_PLUS_SHOW_PARAM
--------------------------------------------------------------------------------
0
db_32k_cache_size
big integer
0
db_4k_cache_size
big integer
0
NAME_COL_PLUS_SHOW_PARAM
--------------------------------------------------------------------------------
TYPE
-----------
VALUE_COL_PLUS_SHOW_PARAM
--------------------------------------------------------------------------------
db_8k_cache_size
big integer
0
db_big_table_cache_percent_target
string
0
db_cache_advice
NAME_COL_PLUS_SHOW_PARAM
--------------------------------------------------------------------------------
TYPE
-----------
VALUE_COL_PLUS_SHOW_PARAM
--------------------------------------------------------------------------------
string
ON
db_cache_size 对应数据库告诉缓冲池的大小
big integer
0
db_flash_cache_file
string
NAME_COL_PLUS_SHOW_PARAM
--------------------------------------------------------------------------------
TYPE
-----------
VALUE_COL_PLUS_SHOW_PARAM
--------------------------------------------------------------------------------
db_flash_cache_size
big integer
0
db_keep_cache_size
big integer
0
NAME_COL_PLUS_SHOW_PARAM
--------------------------------------------------------------------------------
TYPE
-----------
VALUE_COL_PLUS_SHOW_PARAM
--------------------------------------------------------------------------------
db_recycle_cache_size
big integer
0
object_cache_max_size_percent
integer
10
object_cache_optimal_size
NAME_COL_PLUS_SHOW_PARAM
--------------------------------------------------------------------------------
TYPE
-----------
VALUE_COL_PLUS_SHOW_PARAM
--------------------------------------------------------------------------------
integer
10240000
result_cache_max_result
integer
5
result_cache_max_size
big integer
NAME_COL_PLUS_SHOW_PARAM
--------------------------------------------------------------------------------
TYPE
-----------
VALUE_COL_PLUS_SHOW_PARAM
--------------------------------------------------------------------------------
8960K
result_cache_mode
string
MANUAL
result_cache_remote_expiration
integer
0
NAME_COL_PLUS_SHOW_PARAM
--------------------------------------------------------------------------------
TYPE
-----------
VALUE_COL_PLUS_SHOW_PARAM
--------------------------------------------------------------------------------
session_cached_cursors
integer
50
SQL> show parameter cache;
NAME_COL_PLUS_SHOW_PARAM
--------------------------------------------------------------------------------
TYPE
-----------
VALUE_COL_PLUS_SHOW_PARAM
--------------------------------------------------------------------------------
client_result_cache_lag
big integer
3000
client_result_cache_size
big integer
0
data_transfer_cache_size
NAME_COL_PLUS_SHOW_PARAM
--------------------------------------------------------------------------------
TYPE
-----------
VALUE_COL_PLUS_SHOW_PARAM
--------------------------------------------------------------------------------
big integer
0
db_16k_cache_size
big integer
0
db_2k_cache_size
big integer
NAME_COL_PLUS_SHOW_PARAM
--------------------------------------------------------------------------------
TYPE
-----------
VALUE_COL_PLUS_SHOW_PARAM
--------------------------------------------------------------------------------
0
db_32k_cache_size
big integer
0
db_4k_cache_size
big integer
0
NAME_COL_PLUS_SHOW_PARAM
--------------------------------------------------------------------------------
TYPE
-----------
VALUE_COL_PLUS_SHOW_PARAM
--------------------------------------------------------------------------------
db_8k_cache_size
big integer
0
db_big_table_cache_percent_target
string
0
db_cache_advice
NAME_COL_PLUS_SHOW_PARAM
--------------------------------------------------------------------------------
TYPE
-----------
VALUE_COL_PLUS_SHOW_PARAM
--------------------------------------------------------------------------------
string
ON
db_cache_size
big integer
0
db_flash_cache_file
string
NAME_COL_PLUS_SHOW_PARAM
--------------------------------------------------------------------------------
TYPE
-----------
VALUE_COL_PLUS_SHOW_PARAM
--------------------------------------------------------------------------------
db_flash_cache_size
big integer
0
db_keep_cache_size
big integer
0
NAME_COL_PLUS_SHOW_PARAM
--------------------------------------------------------------------------------
TYPE
-----------
VALUE_COL_PLUS_SHOW_PARAM
--------------------------------------------------------------------------------
db_recycle_cache_size
big integer
0
object_cache_max_size_percent
integer
10
object_cache_optimal_size
NAME_COL_PLUS_SHOW_PARAM
--------------------------------------------------------------------------------
TYPE
-----------
VALUE_COL_PLUS_SHOW_PARAM
--------------------------------------------------------------------------------
integer
10240000
result_cache_max_result
integer
5
result_cache_max_size
big integer
NAME_COL_PLUS_SHOW_PARAM
--------------------------------------------------------------------------------
TYPE
-----------
VALUE_COL_PLUS_SHOW_PARAM
--------------------------------------------------------------------------------
8960K
result_cache_mode
string
MANUAL
result_cache_remote_expiration
integer
0
NAME_COL_PLUS_SHOW_PARAM
--------------------------------------------------------------------------------
TYPE
-----------
VALUE_COL_PLUS_SHOW_PARAM
--------------------------------------------------------------------------------
session_cached_cursors
integer
Oracle等待事件
•等待事件集合提供了由于不同原因必须等待或必须等待的会话或进程的信息。
•这些事件列在V$EVENT_NAME视图中。
Memory Management: Overview
DBAs must consider memory management to be a crucial part of their job because:
• There is a finite amount of memory available
• Allocating more memory to serve certain types of functions can improve overall performance
• Automatically tuned memory allocation is often the appropriate configuration, but specific environments or even short-term conditions may require further attention
内存管理:概述
DBA必须将内存管理视为其工作的关键部分,因为:
•内存有限
•为某些类型的功能分配更多内存可以提高整体性能
•自动调整内存分配通常是适当的配置,但特定环境甚至短期条件可能需要进一步关注
Managing Memory Components
• Automatic Memory Management (AMM) enables you to specify total memory allocated to instance (including both SGA and PGA)
• Automatic Shared Memory Management (ASMM): ASMM可对SGA内存块自动调优
– Enables you to specify total SGA memory through one initialization parameter
– Enables the Oracle server to manage the amount of memory allocated to the shared pool, Java pool, buffer cache, streams pool, and large pool
• Manually setting shared memory management:
– Sizes the components through multiple individual initialization parameters
– Uses the appropriate Memory Advisor to make recommendations
管理内存组件
•自动内存管理(AMM)允许您指定分配给实例的总内存(包括SGA和PGA)
•自动共享内存管理(ASMM):
–允许您通过一个初始化参数指定SGA内存总量
–使Oracle服务器能够管理分配给共享池、Java池、缓冲区缓存、流池和大池的内存量 (redu log_buffer 无法自动调优)
•手动设置共享内存管理:
–通过多个单独的初始化参数调整组件的大小
–使用适当的内存顾问提出建议
SQL> show parameter log_buffer 查看在线日志缓冲池大小
NAME_COL_PLUS_SHOW_PARAM
--------------------------------------------------------------------------------
TYPE
-----------
VALUE_COL_PLUS_SHOW_PARAM
--------------------------------------------------------------------------------
log_buffer
big integer
7584K
SQL> show parameter sga_max_size
NAME_COL_PLUS_SHOW_PARAM
--------------------------------------------------------------------------------
TYPE
-----------
VALUE_COL_PLUS_SHOW_PARAM
--------------------------------------------------------------------------------
sga_max_size
big integer
1744M
SQL> show parameter sga_target
NAME_COL_PLUS_SHOW_PARAM
--------------------------------------------------------------------------------
TYPE
-----------
VALUE_COL_PLUS_SHOW_PARAM
--------------------------------------------------------------------------------
sga_target
big integer
1744M
只要 sga_target小于sga_max_size 则数据库可以正常启动
SQL> col TYPE format a20
SQL> col VALUE format a20
set linesize 900
set pagesize 800
USER is "SYS"
SQL> show parameter memory;
NAME_COL_PLUS_SHOW_PARAM TYPE VALUE_COL_PLUS_SHOW_PARAM
------------------------------ -------------------- -----------------------------------
hi_shared_memory_address integer 0
inmemory_adg_enabled boolean TRUE
inmemory_automatic_level string OFF
inmemory_clause_default string
inmemory_expressions_usage string ENABLE
inmemory_force string DEFAULT
inmemory_max_populate_servers integer 0
inmemory_optimized_arithmetic string DISABLE
inmemory_prefer_xmem_memcompre string
ss
inmemory_prefer_xmem_priority string
inmemory_query string ENABLE
inmemory_size big integer 0
inmemory_trickle_repopulate_se integer 1
rvers_percent
inmemory_virtual_columns string MANUAL
inmemory_xmem_size big integer 0
memory_max_target big integer 0
memory_target big integer 0 说明当前AMM功能时关闭的
optimizer_inmemory_aware boolean TRUE
shared_memory_address integer 0
Efficient Memory Usage: Guidelines
• Fit the SGA into physical memory. SGA分配的时候要使用物理内存而不是虚拟内存
• Use the Memory Advisors. 可查看内存管理指导中心
• Tune for the most efficient use of memory
– Reduce overall physical I/O
– Reduce the total memory needs
有效内存使用:准则
•将SGA放入物理内存。
•使用内存顾问。
•优化内存使用效率
–减少总体物理I/O
减少总内存需求

Automatic Memory Management: Overview
With Automatic Memory Management, the database server can size the SGA and PGA automatically according to your workload.
Oracle recommends the use of AMM unless you have special requirements.
自动内存管理:概述
通过自动内存管理,数据库服务器可以根据您的工作负载自动调整SGA和PGA的大小。
除非您有特殊要求,否则Oracle建议使用AMM。
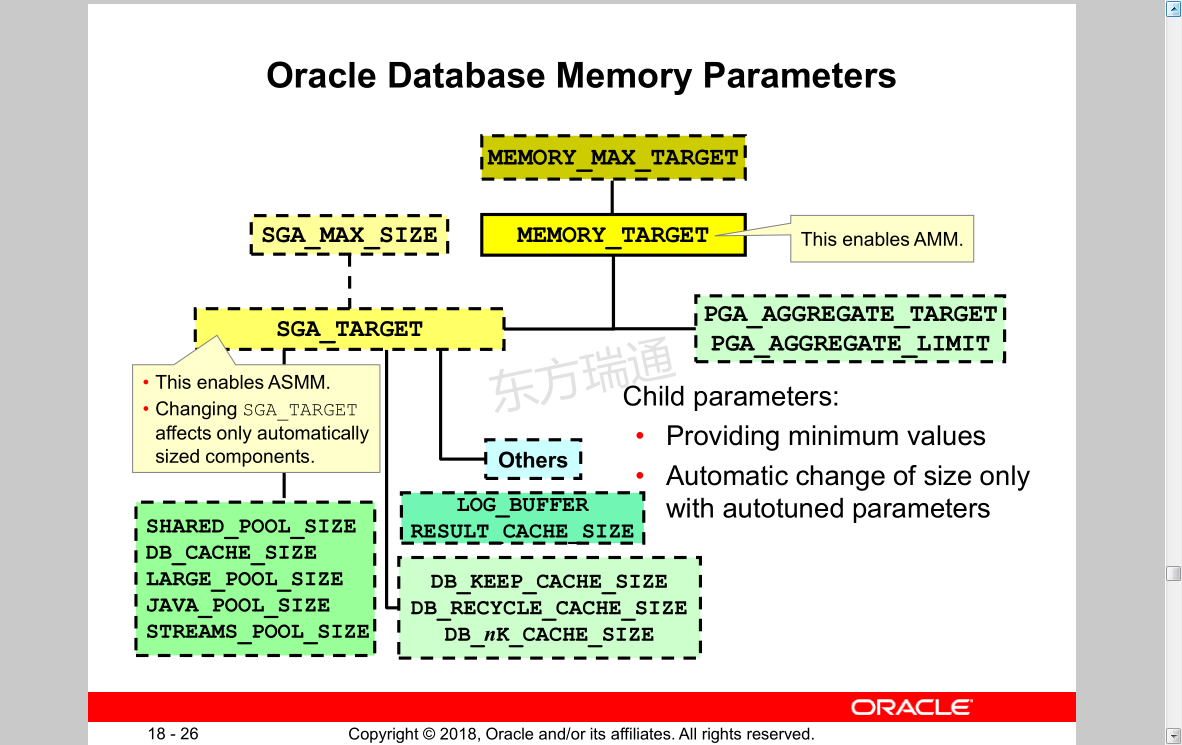
Oracle Database Memory Parameters
Oracle数据库内存参数
Child parameters:
• Providing minimum values
• Automatic change of size only with autotuned parameters
子参数:
•提供最小值
•仅使用自动调谐参数自动更改尺寸
Enabling Automatic Memory Management (AMM) by Using Enterprise Manager Cloud Control
使用Enterprise Manager云控制启用自动内存管理(AMM)
Monitoring Automatic Memory Management
监视自动内存管理
Monitoring Automatic Memory Management
Use the following views to monitor Automatic Memory
Management:
• V$MEMORY_DYNAMIC_COMPONENTS: Current status of all memory components
• V$MEMORY_RESIZE_OPS: Circular history buffer of the last 800 memory resize requests
• V$MEMORY_TARGET_ADVICE: Tuning advice for the MEMORY_TARGET initialization parameter
监视自动内存管理
使用以下视图监视自动内存
管理层:
•V$MEMORY_DYNAMIC_COMPONENTS:所有内存组件的当前状态
•V$MEMORY_RESIZE_OPS:最近800个内存大小调整请求的循环历史缓冲区
•V$MEMORY_TARGET_ADVICE:针对MEMORY_TARGET初始化参数的调整建议
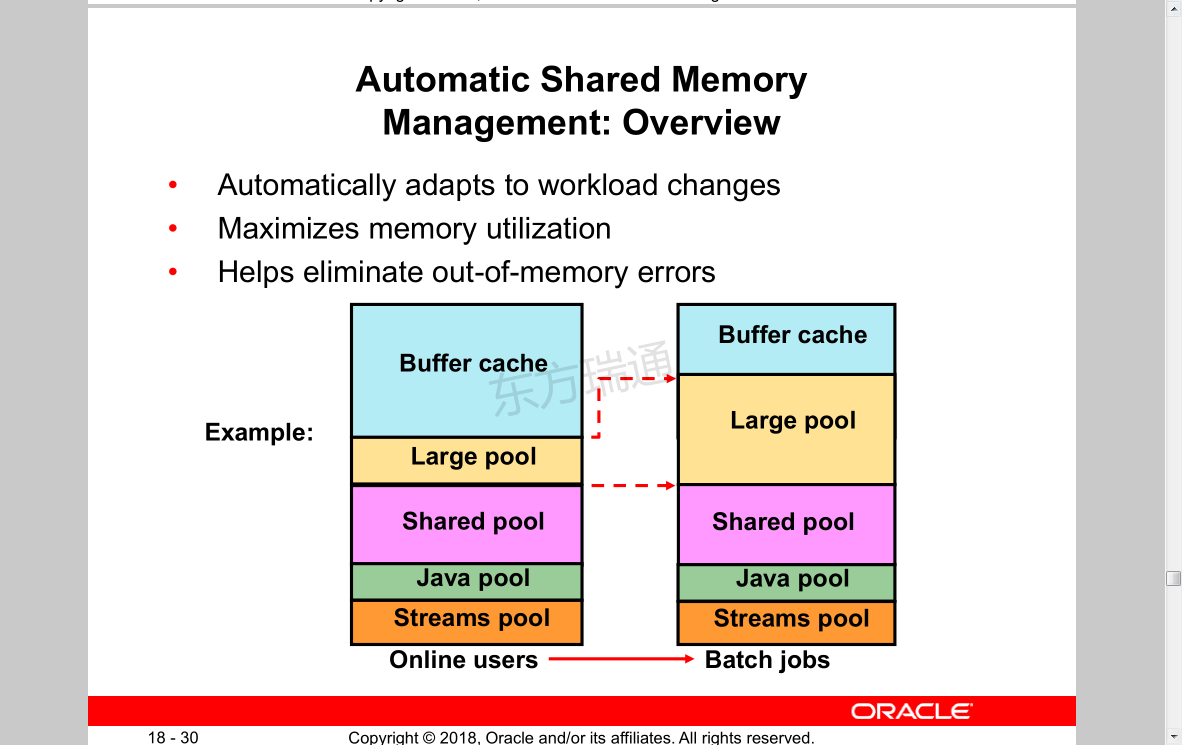
Automatic Shared Memory Management: Overview
• Automatically adapts to workload changes
• Maximizes memory utilization
• Helps eliminate out-of-memory errors
自动共享内存管理:概述
•自动适应工作量变化
•最大限度地利用内存
•有助于消除内存不足错误
Enabling Automatic Shared Memory Management (ASMM)
启用自动共享内存管理(ASMM)
Understanding Automatic Shared Memory Management
• ASMM is based on workload information that MMON captures in the background.
• MMON uses memory advisors.
• Memory is moved to where it is needed the most by MMAN.
• If an SPFILE is used (which is recommended):
– Component sizes are saved across shutdowns
– Saved values are used to bootstrap component sizes
– There is no need to relearn optimal values
了解自动共享内存管理
•ASMM基于MMON在后台捕获的工作负载信息。
•MMON使用内存顾问。
•内存被MMAN移动到最需要的地方。
•如果使用SPFILE(推荐):
–部件尺寸在停机时得以保存
–保存的值用于引导组件大小
–无需重新学习最佳值
Automatic Shared Memory Advisor
自动共享内存顾问
Enabling Automatic Shared Memory Management
To enable ASMM from manual shared memory management:
1. Get a value for SGA_TARGET:
SELECT ((SELECT SUM(value) FROM V$SGA) - (SELECT CURRENT_SIZE
FROM V$SGA_DYNAMIC_FREE_MEMORY)) "SGA_TARGET" FROM DUAL;
2. Use that value to set SGA_TARGET.
3. Set the values of the automatically sized SGA components to 0.
To switch to ASMM from Automatic Memory Management:
1. Set the MEMORY_TARGET initialization parameter to 0.
2. Set the values of the automatically sized SGA components to 0.
启用自动共享内存管理
要从手动共享内存管理启用ASMM,请执行以下操作:
1获取SGA_TARGET的值:
2使用该值设置SGA_目标。
3将自动调整大小的SGA组件的值设置为0。
要从自动内存管理切换到ASMM,请执行以下操作:
1将MEMORY_TARGET初始化参数设置为0。
2将自动调整大小的SGA组件的值设置为0
Disabling Automatic Shared Memory Management
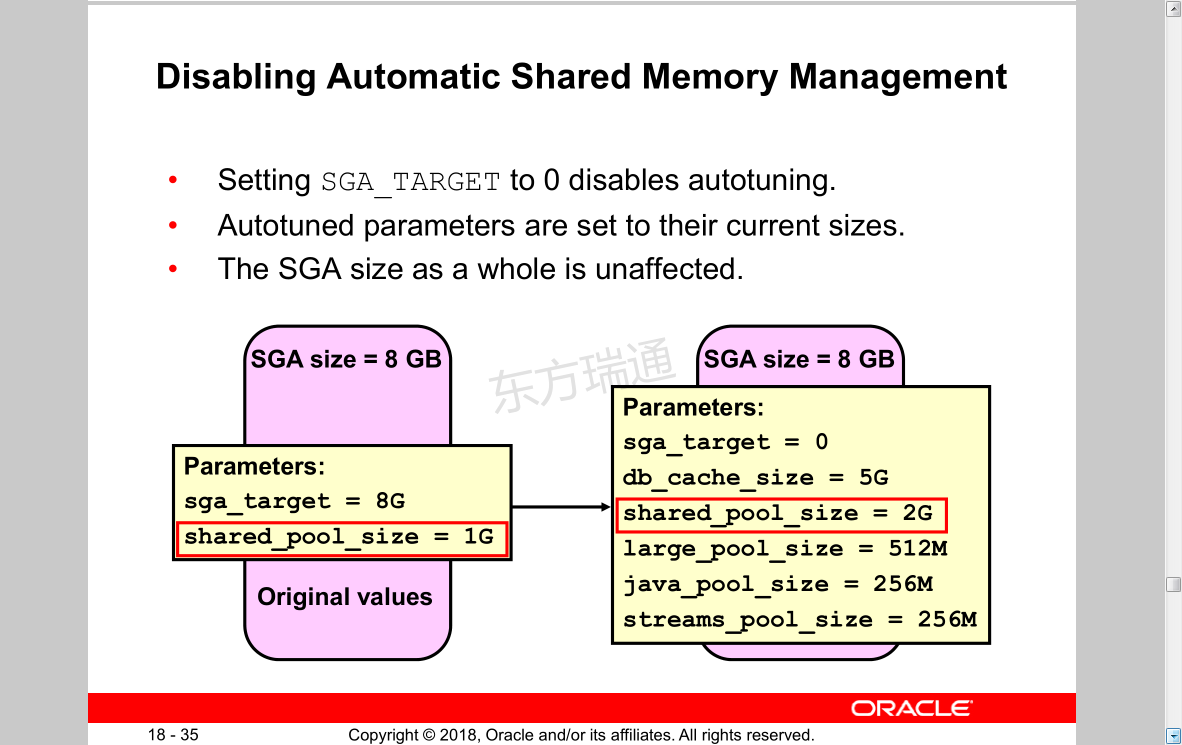
• Setting SGA_TARGET to 0 disables autotuning.
• Autotuned parameters are set to their current sizes.
• The SGA size as a whole is unaffected.
禁用自动共享内存管理
•将SGA_目标设置为0将禁用自动调整。
•自动调谐参数设置为其当前大小。
•SGA整体尺寸不受影响
Using V$PARAMETER to View Memory Component Sizes
使用V$参数查看内存组件大小
SGA_TARGET = 8G
DB_CACHE_SIZE = 0
JAVA_POOL_SIZE = 0
LARGE_POOL_SIZE = 0
SHARED_POOL_SIZE = 0
STREAMS_POOL_SIZE = 0
SELECT name, value, isdefault
FROM v$parameter
WHERE name LIKE '%size';

Managing the Program Global Area (PGA)
管理采办项目全球区域(PGA)
Automatic PGA memory management is enabled by default.
默认情况下启用自动PGA内存管理。
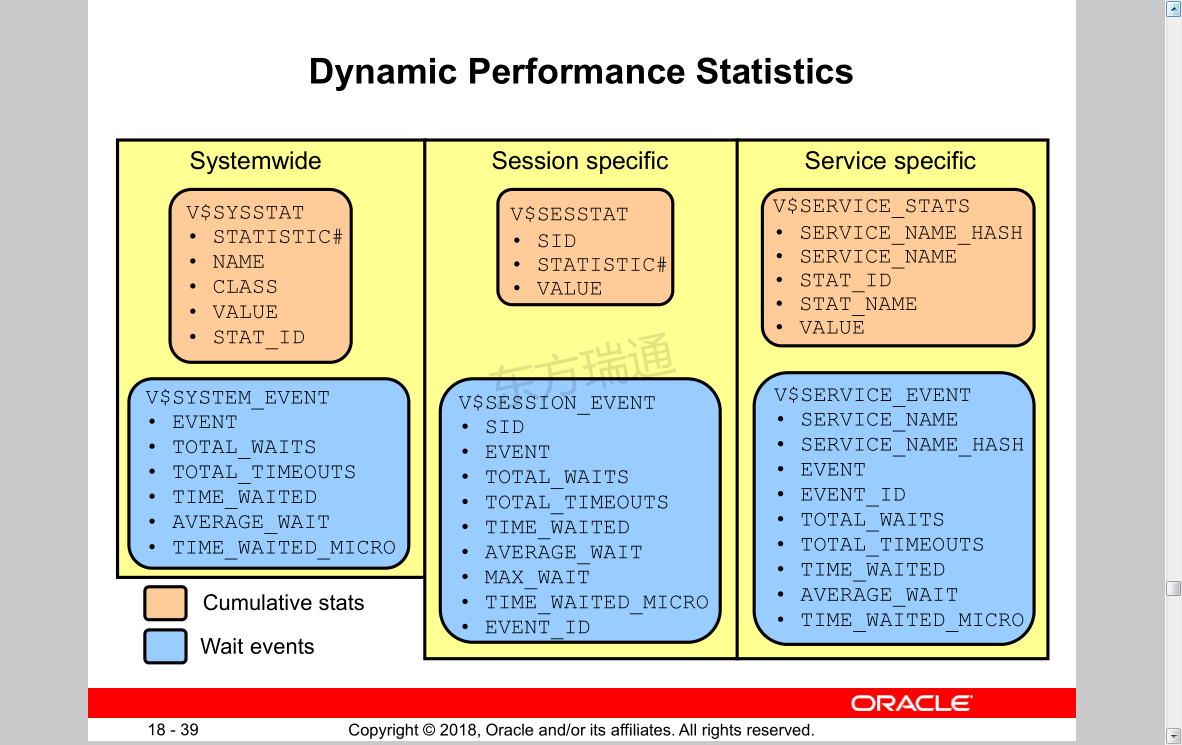
Dynamic Performance Statistics
动态性能统计
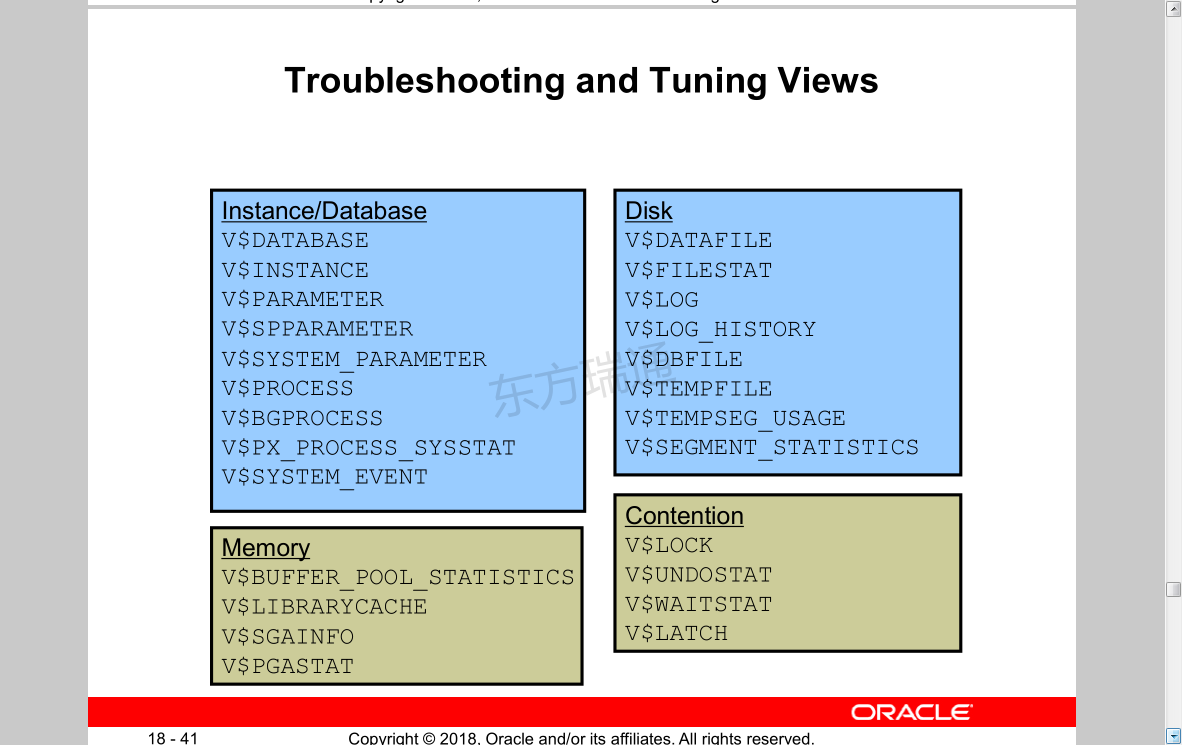
Troubleshooting and Tuning Views
故障排除和调整视图
Quiz
Automatic Memory Management allows the Oracle instance to
reallocate memory from the _______ to the SGA .
a. Large Pool
b. Log Buffer
c. PGA
d. Streams Pool
c
Quiz
SGA_TARGET may not be sized greater than __________ .
a. LOG_BUFFER
b. SGA_MAX_SIZE
c. STREAMS_POOL_SIZE
d. PGA_AGGREGATE_TARGET
b
Summary
In this lesson, you should have learned how to use:
• Enterprise Manager to monitor performance
• Automatic Memory Management (AMM)
• The Memory Advisor to size memory buffers
摘要
在本课中,您应该学习如何使用:
•企业经理监控绩效
•自动内存管理(AMM)
•内存顾问调整内存缓冲区的大小
Practice: Overview
This practice covers the following topics:
• Using the Performance page in Enterprise Manager
• Diagnosing a memory allocation problem
• Enabling and implementing Automatic Memory Management
• Monitoring Top Services and Sessions
实践:概述
本实践包括以下主题:
•在Enterprise Manager中使用性能页面
•诊断内存分配问题
•启用和实施自动内存管理
•监控顶级服务和会话