安装
准备
- 5台机器
172.16.240.60  db01  filebeat elasticsearch
172.16.240.70  db02  kibana
172.16.240.80  db03  filebeat nginx tomcat
172.16.240.81  db04  filebeat nginx tomcat
172.16.240.90  db05  logstash
- 安装阿里yum和java
curl -o /etc/yum.repos.d/CentOS-Base.repo http://mirrors.aliyun.com/repo/Centos-7.repo
yum install java-1.8.0-openjdk.x86_64 -y
- 更新时间
yum install ntpdate -y
ntpdate time1.aliyun.com
elasticsearch + filebeat
172.16.240.60
elasticsearch安装
mkdir -p /data/soft
cd /data/soft
rpm -ivh elasticsearch-6.6.0.rpm
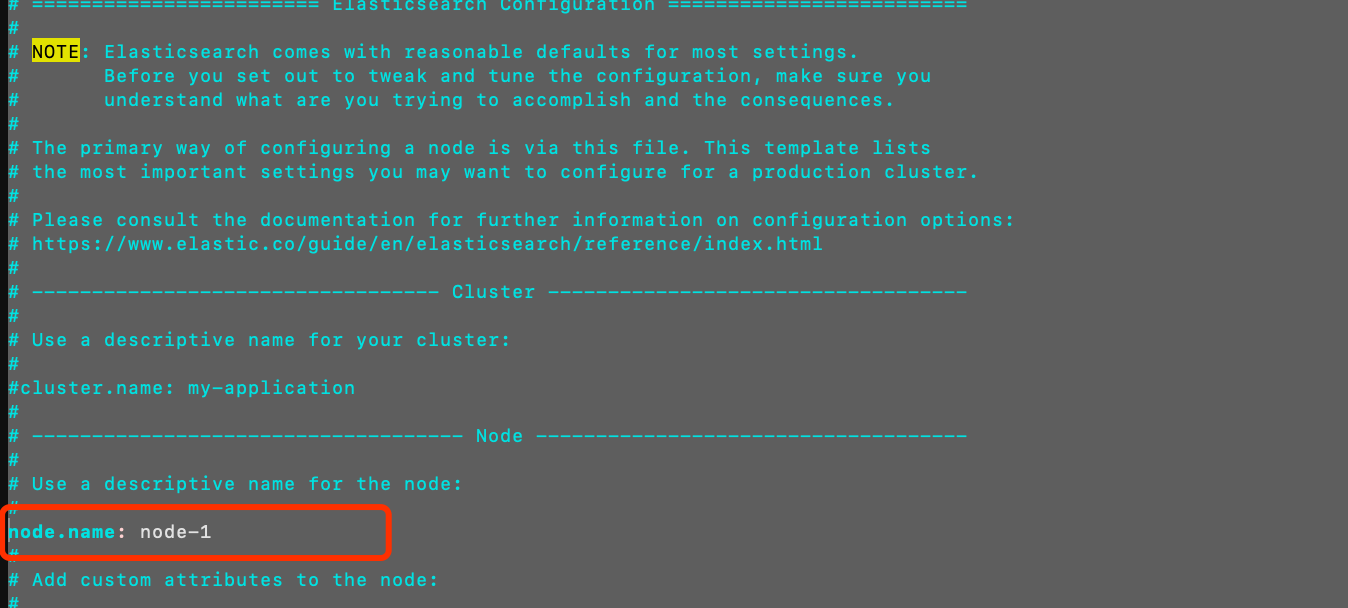
vim /etc/elasticsearch/elasticsearch.yml
node.name: node-1
path.data: /var/lib/elasticsearch
path.logs: /var/log/elasticsearch
network.host: 0.0.0.0
http.port: 9200
vim /usr/lib/systemd/system/elasticsearch.service
[Service]
LimitMEMLOCK=infinity
systemctl daemon-reload
systemctl enable elasticsearch.service
systemctl start elasticsearch.service
-
验证
curl 172.16.240.60:9200

安装filebeat
mkdir -p /data/soft
cd /data/soft/
rpm -ivh filebeat-6.6.0-x86_64.rpm
systemctl start tomcat
systemctl enable tomcat
配置filebeat
vim /etc/filebeat/filebeat.yml
  filebeat.inputs:
  - type: log
    enabled: true
    paths:
      - /var/log/nginx/access.log
  filebeat.config.modules:
    path: ${path.config}/modules.d/*.yml
    reload.enabled: false
  setup.template.settings:
    index.number_of_shards: 3
  setup.kibana:
  output.elasticsearch:
    hosts: ["172.16.240.60:9200"]
  processors:
    - add_host_metadata: ~
    - add_cloud_metadata: ~

systemctl start filebeat
systemctl enable filebeat
Kibana
172.16.240.70
安装kibana
mkdir -p /data/soft
cd /data/soft
rpm -ivh kibana-6.6.0-x86_64.rpm
rpm -qc kibana
	/etc/kibana/kibana.yml

vim /etc/kibana/kibana.yml
  server.port: 5601
  server.host: "172.16.240.70"
  server.name: "db02"
  elasticsearch.hosts: ["http://172.16.240.60:9200/"]
  kibana.index: ".kibana"

systemctl start kibana
systemctl enable kibana
-
验证
访问
http://172.16.240.70:5601/

Filebeat + nginx + tomcat
172.16.240.80 172.16.240.81
安装nginx
-
配置nginx的yum源
- 安装 yum-utils
yum install yum-utils -y
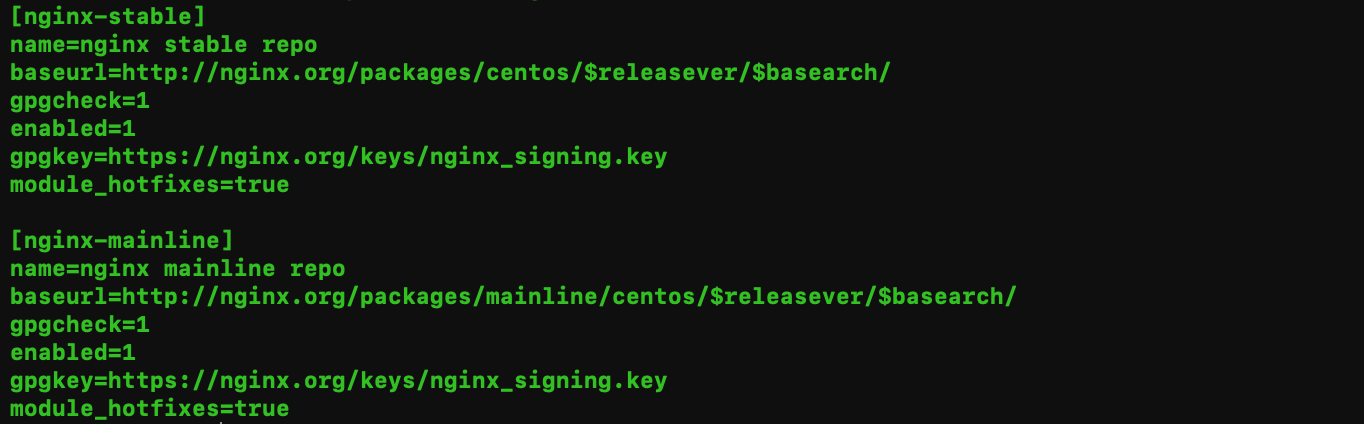
- 创建文件
/etc/yum.repos.d/nginx.repo
[nginx-stable]
name=nginx stable repo
baseurl=http://nginx.org/packages/centos/$releasever/$basearch/
gpgcheck=1
enabled=1
gpgkey=https://nginx.org/keys/nginx_signing.key
module_hotfixes=true

[nginx-mainline]
name=nginx mainline repo
baseurl=http://nginx.org/packages/mainline/centos/$releasever/$basearch/
gpgcheck=1
enabled=0
gpgkey=https://nginx.org/keys/nginx_signing.key
module_hotfixes=true
vim /etc/yum.repos.d/nginx.repo
yum-config-manager --enable nginx-mainline
yum -y install httpd-tools nginx
systemctl start nginx
systemctl enable nginx
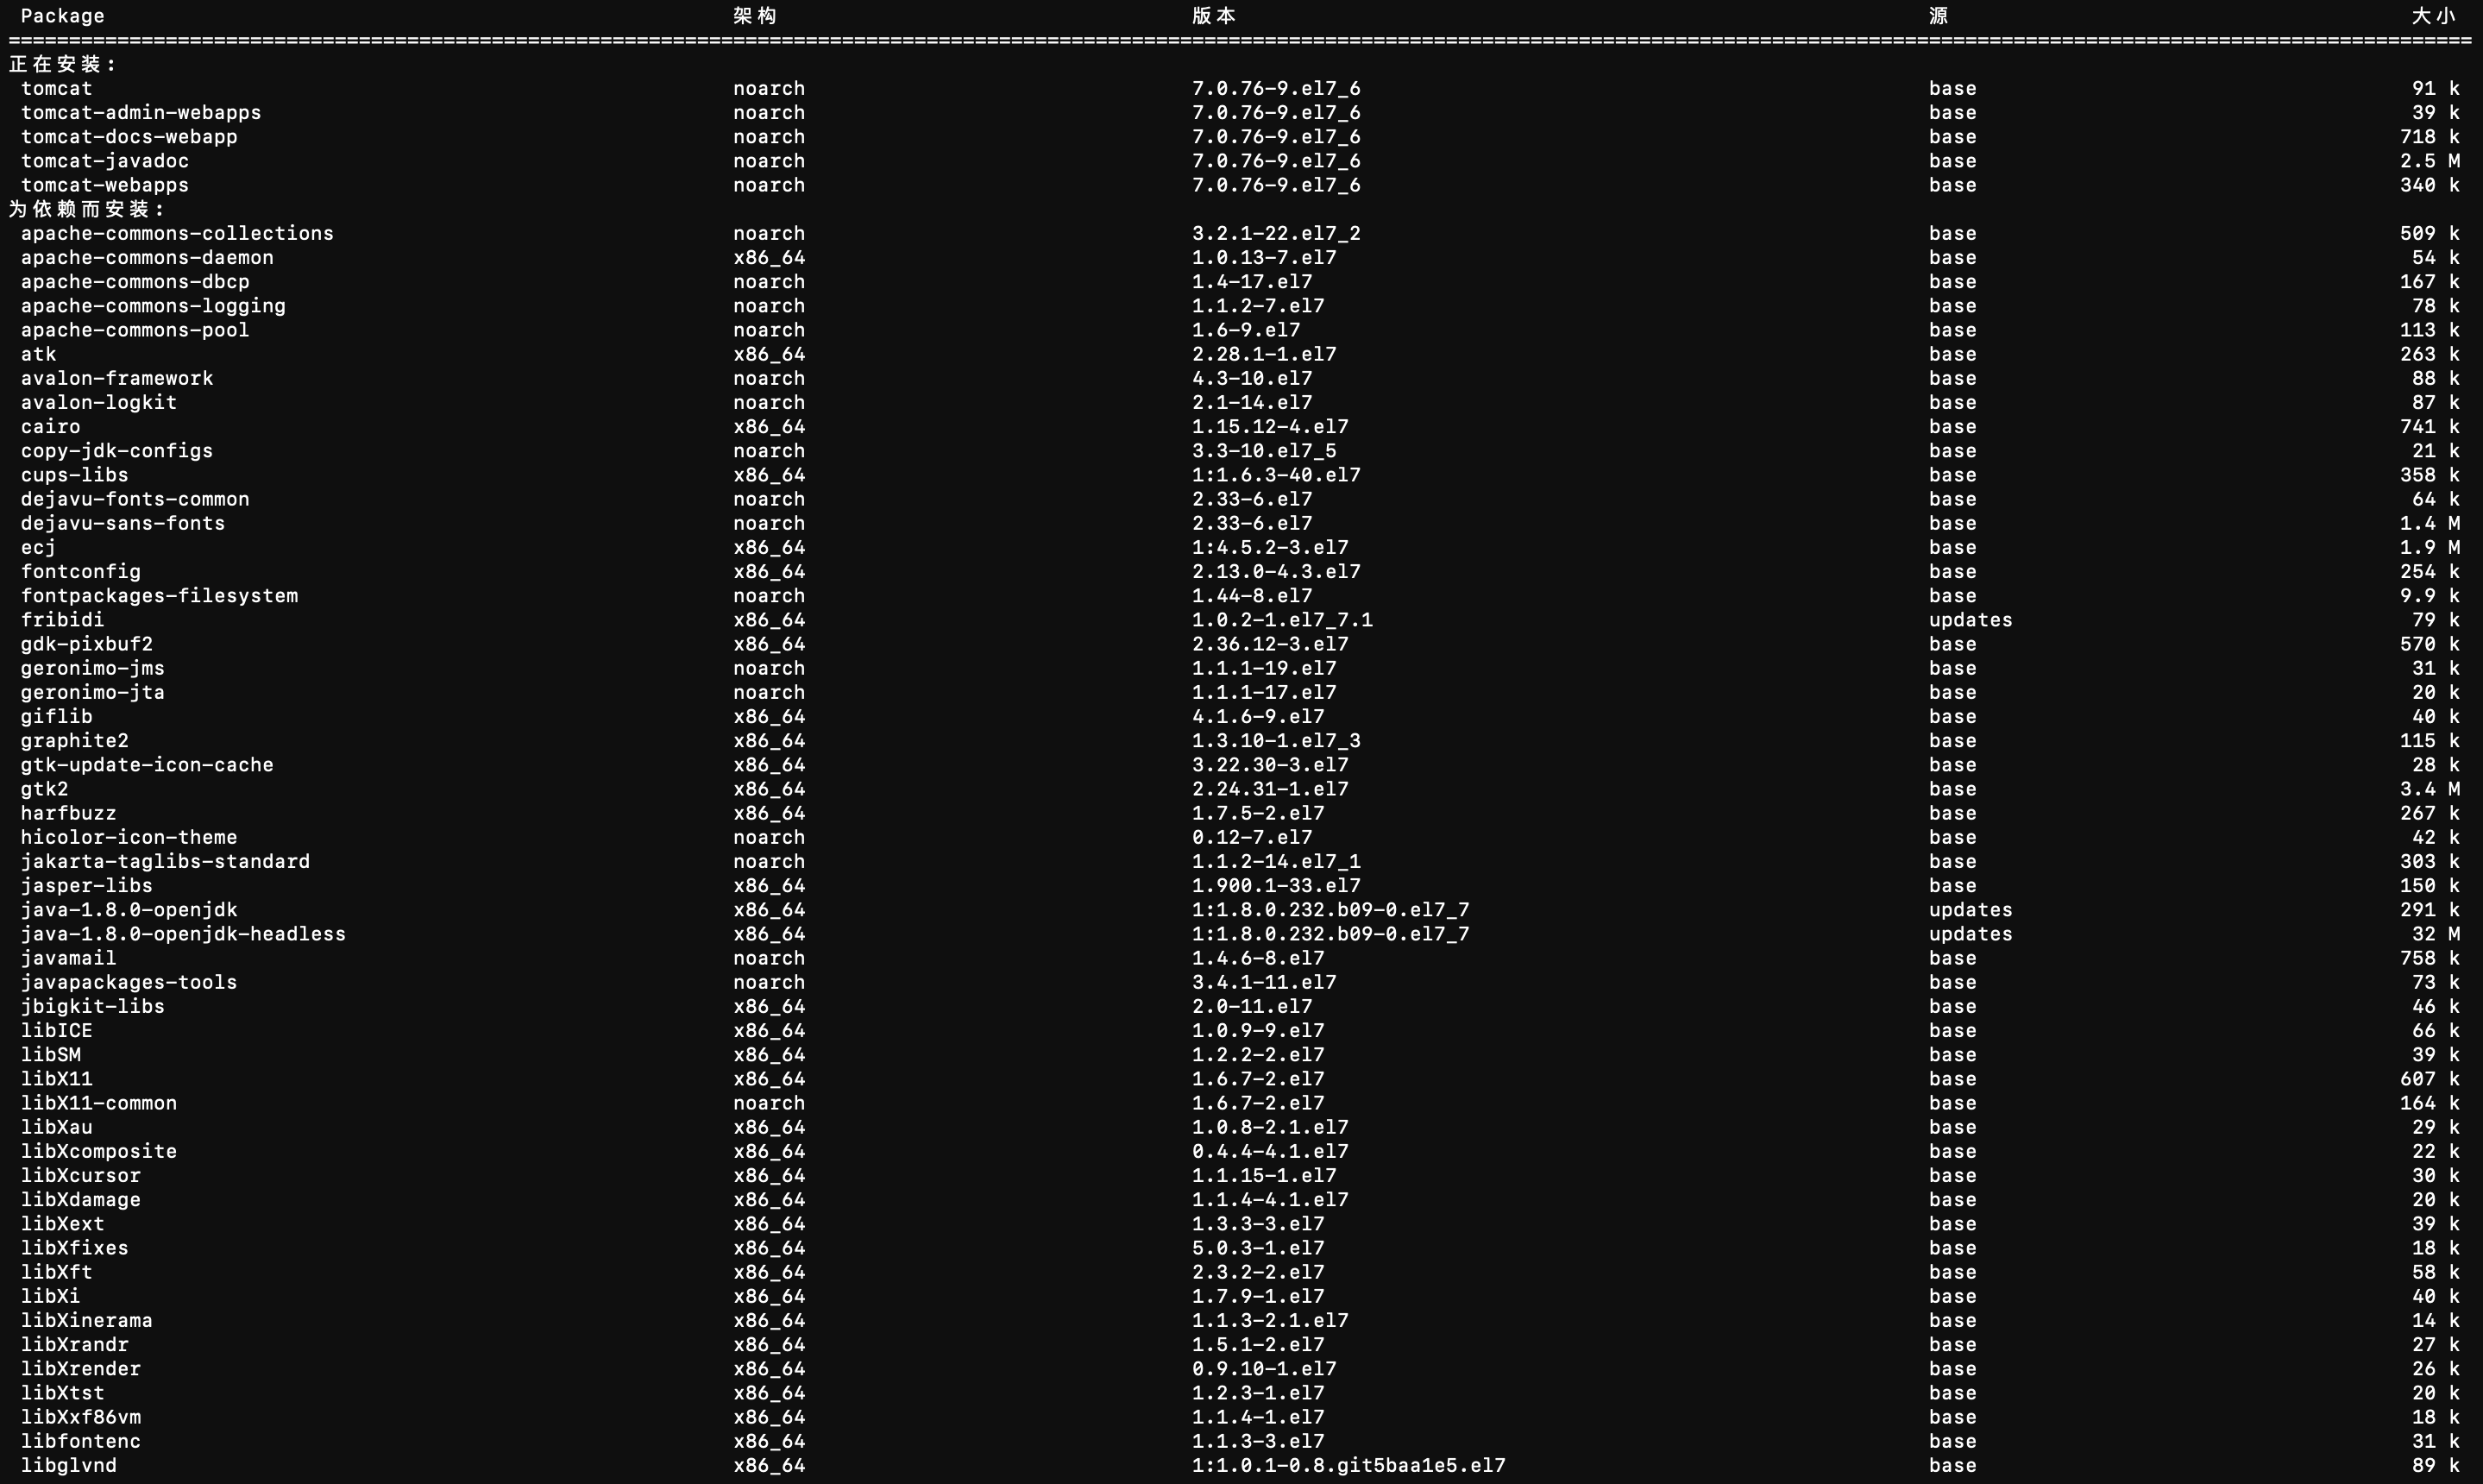
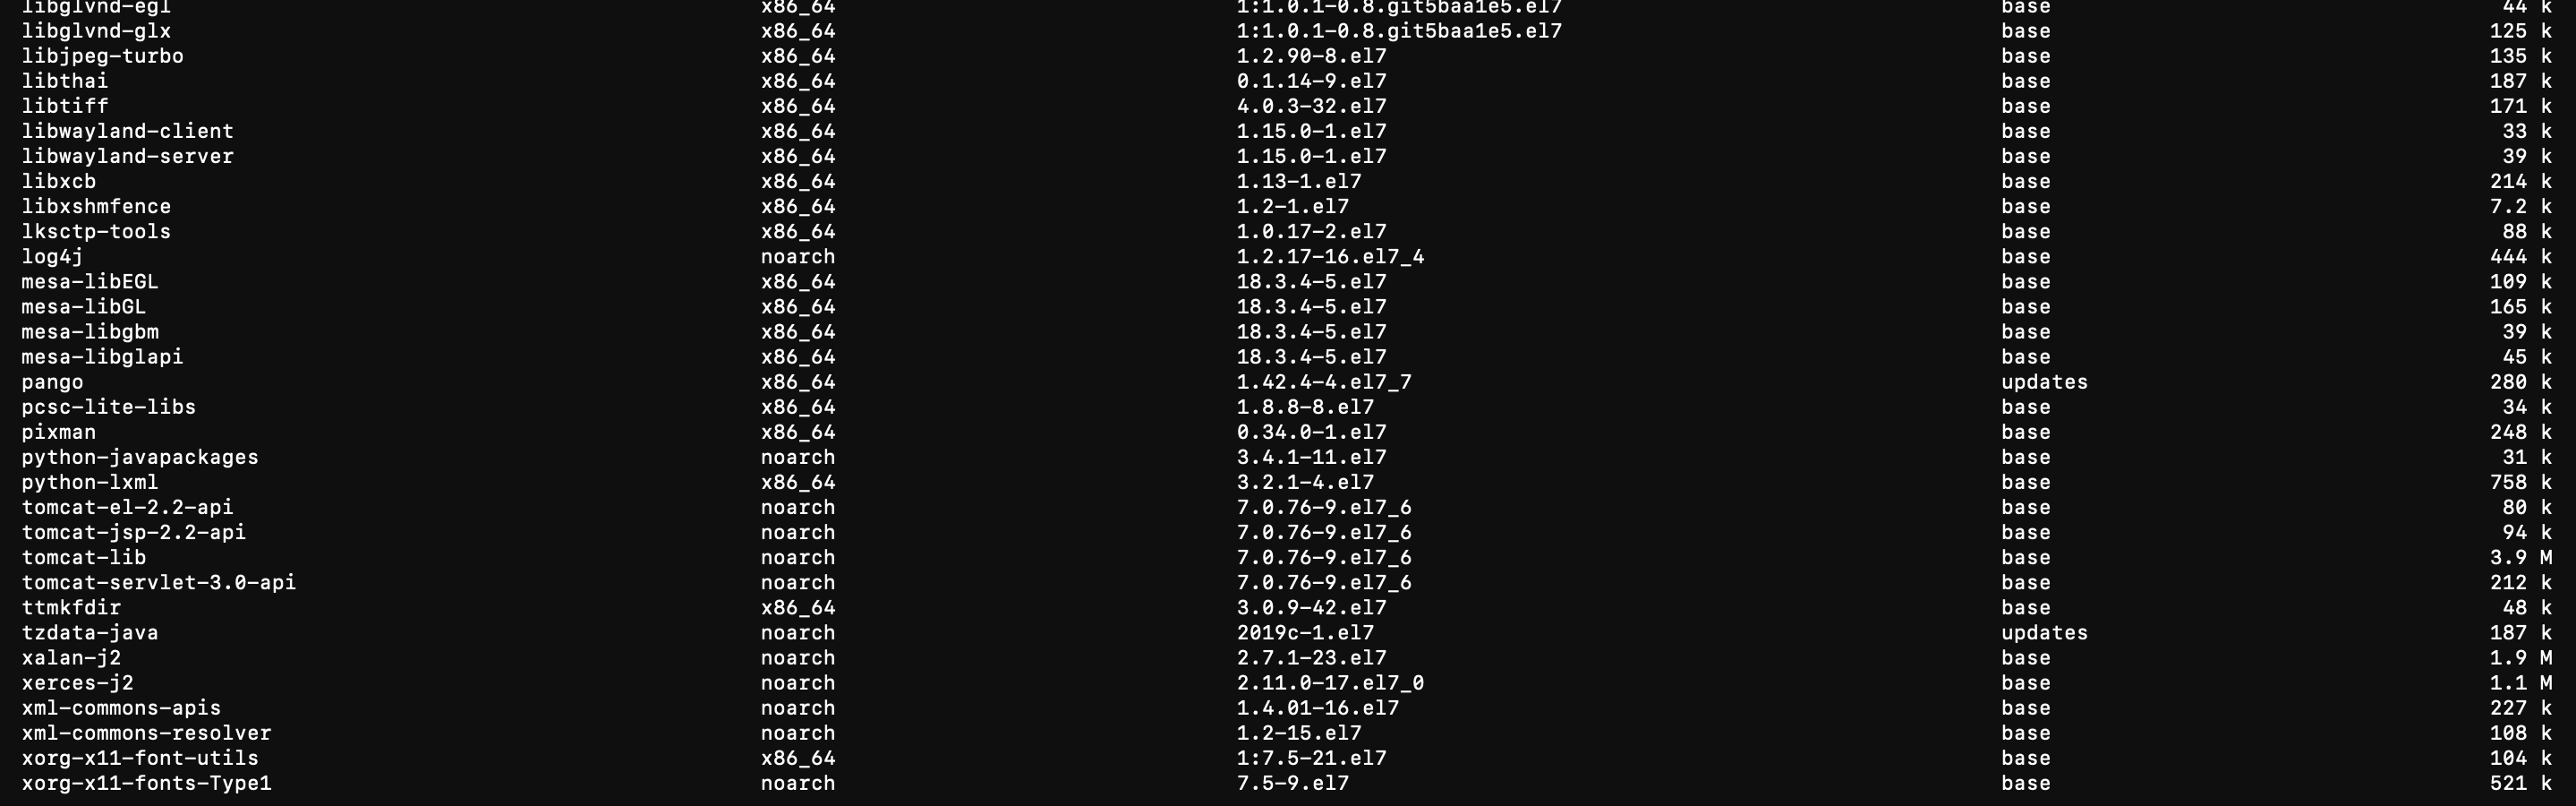
安装Tomcat
yum install tomcat tomcat-webapps tomcat-admin-webapps tomcat-docs-webapp tomcat-javadoc -y
安装filebeat
mkdir -p /data/soft
cd /data/soft/
rpm -ivh filebeat-6.6.0-x86_64.rpm
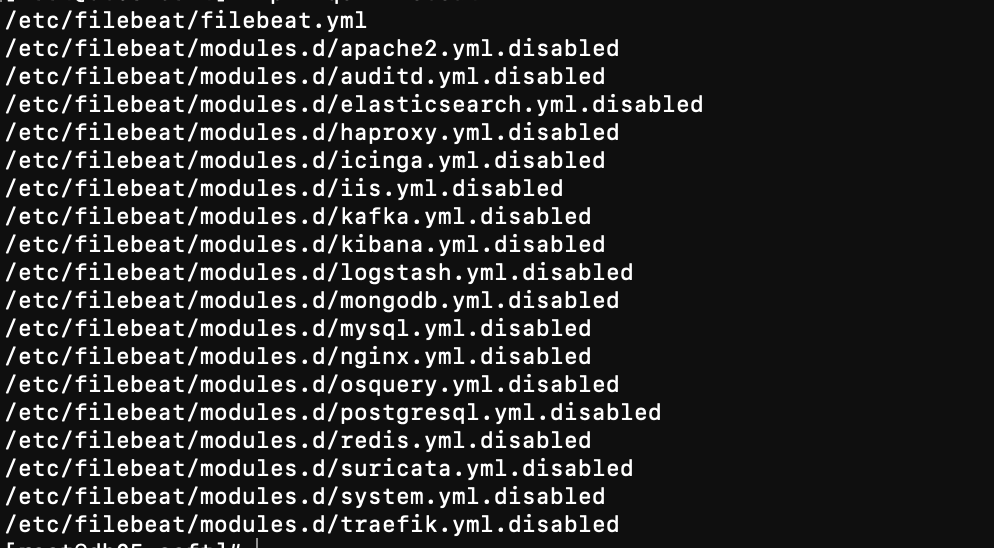
- 查看filebeat的配置文件
rpm -qc filebeat
systemctl start tomcat
systemctl enable tomcat
配置filebeat
vim /etc/filebeat/filebeat.yml
  filebeat.inputs:
  - type: log
    enabled: true
    paths:
      - /var/log/nginx/access.log
  filebeat.config.modules:
    path: ${path.config}/modules.d/*.yml
    reload.enabled: false
  setup.template.settings:
    index.number_of_shards: 3
  setup.kibana:
  output.elasticsearch:
    hosts: ["172.16.240.60:9200"]
  processors:
    - add_host_metadata: ~
    - add_cloud_metadata: ~

systemctl start filebeat
systemctl enable filebeat
验证日志
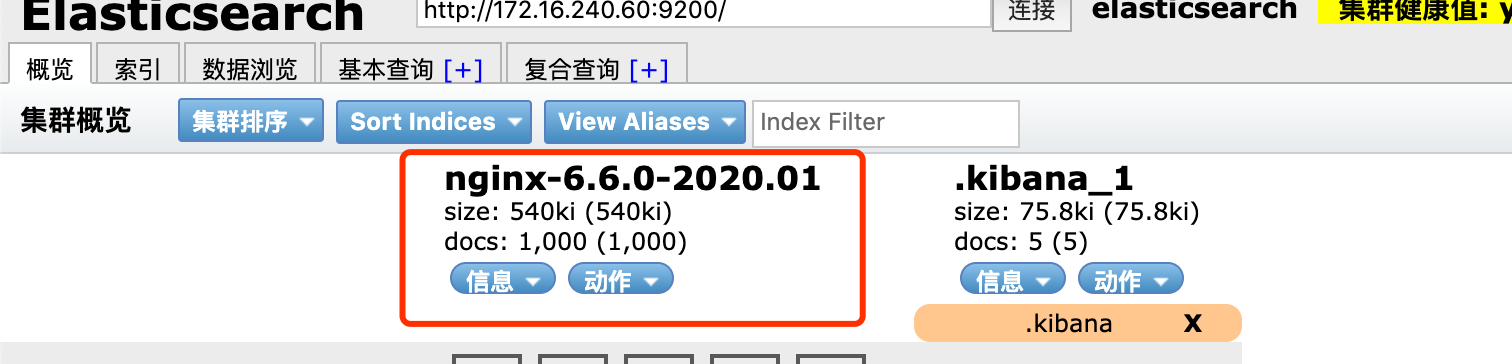
- 通过chrom插件 elasticsearch head 查看
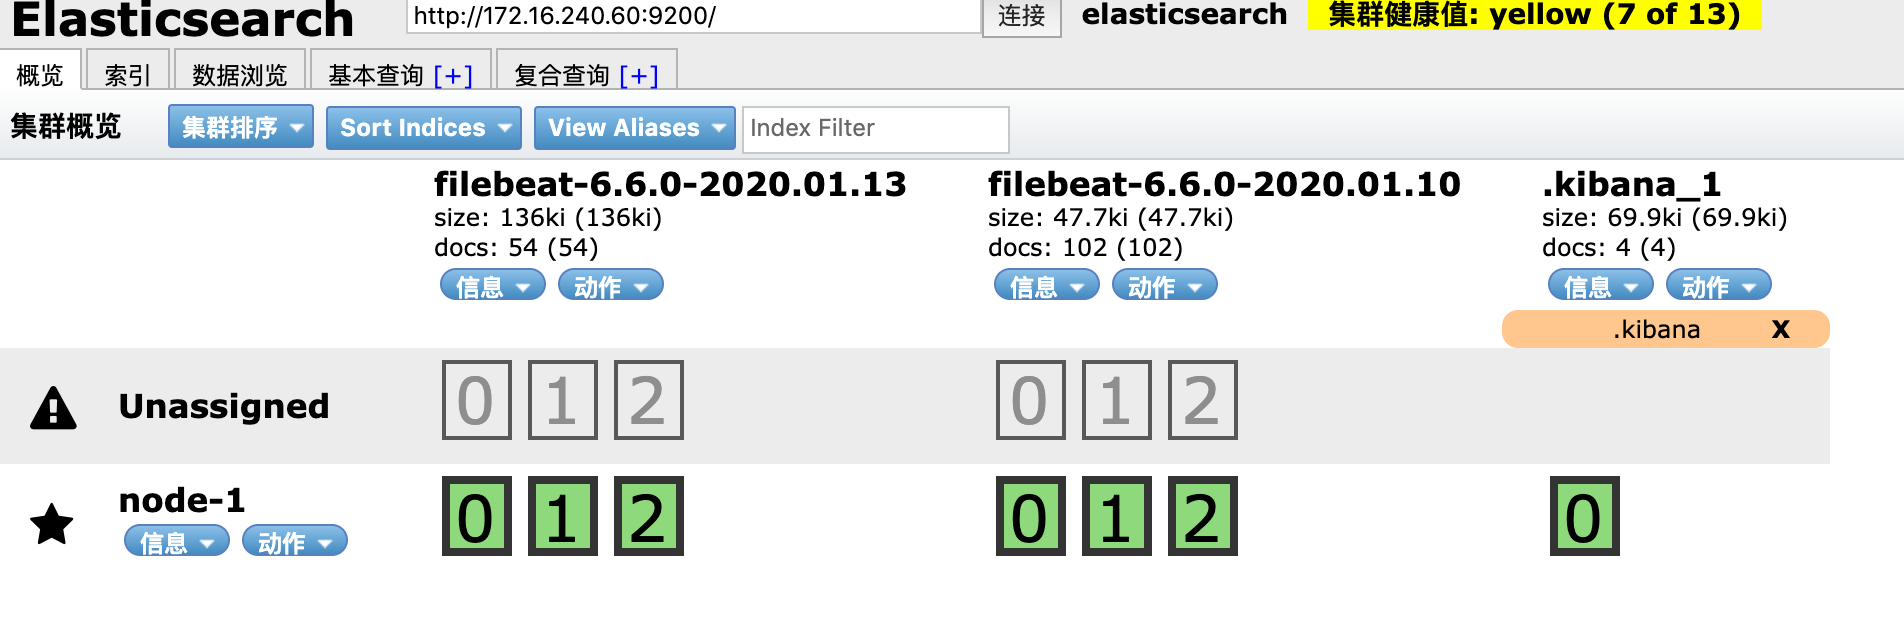
-
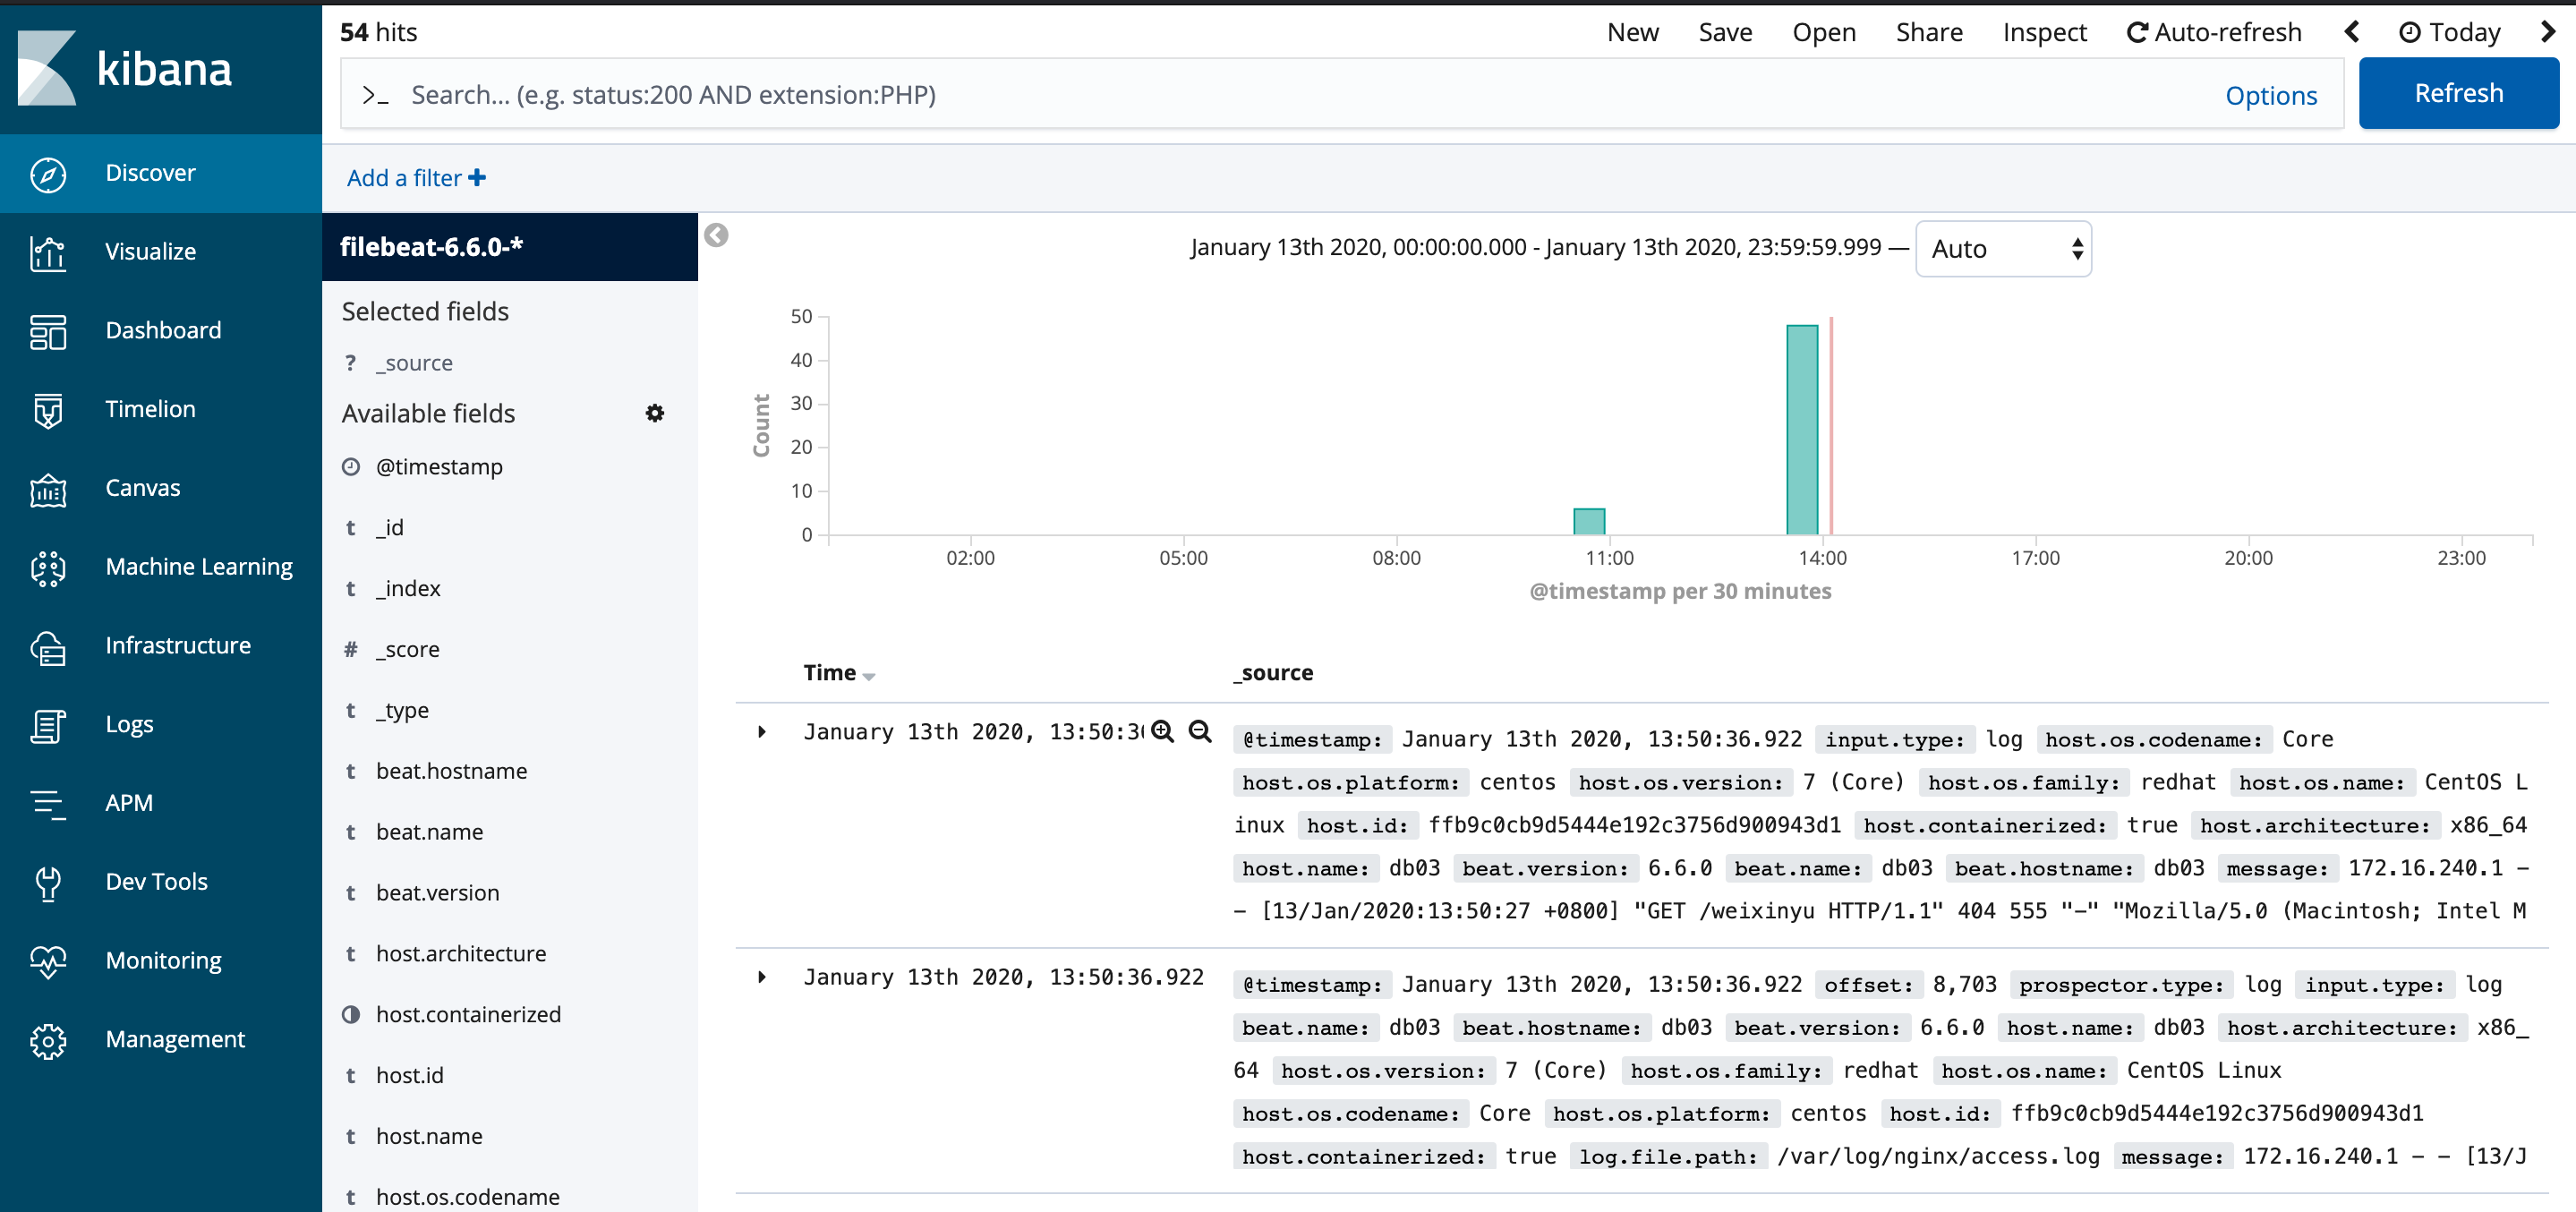
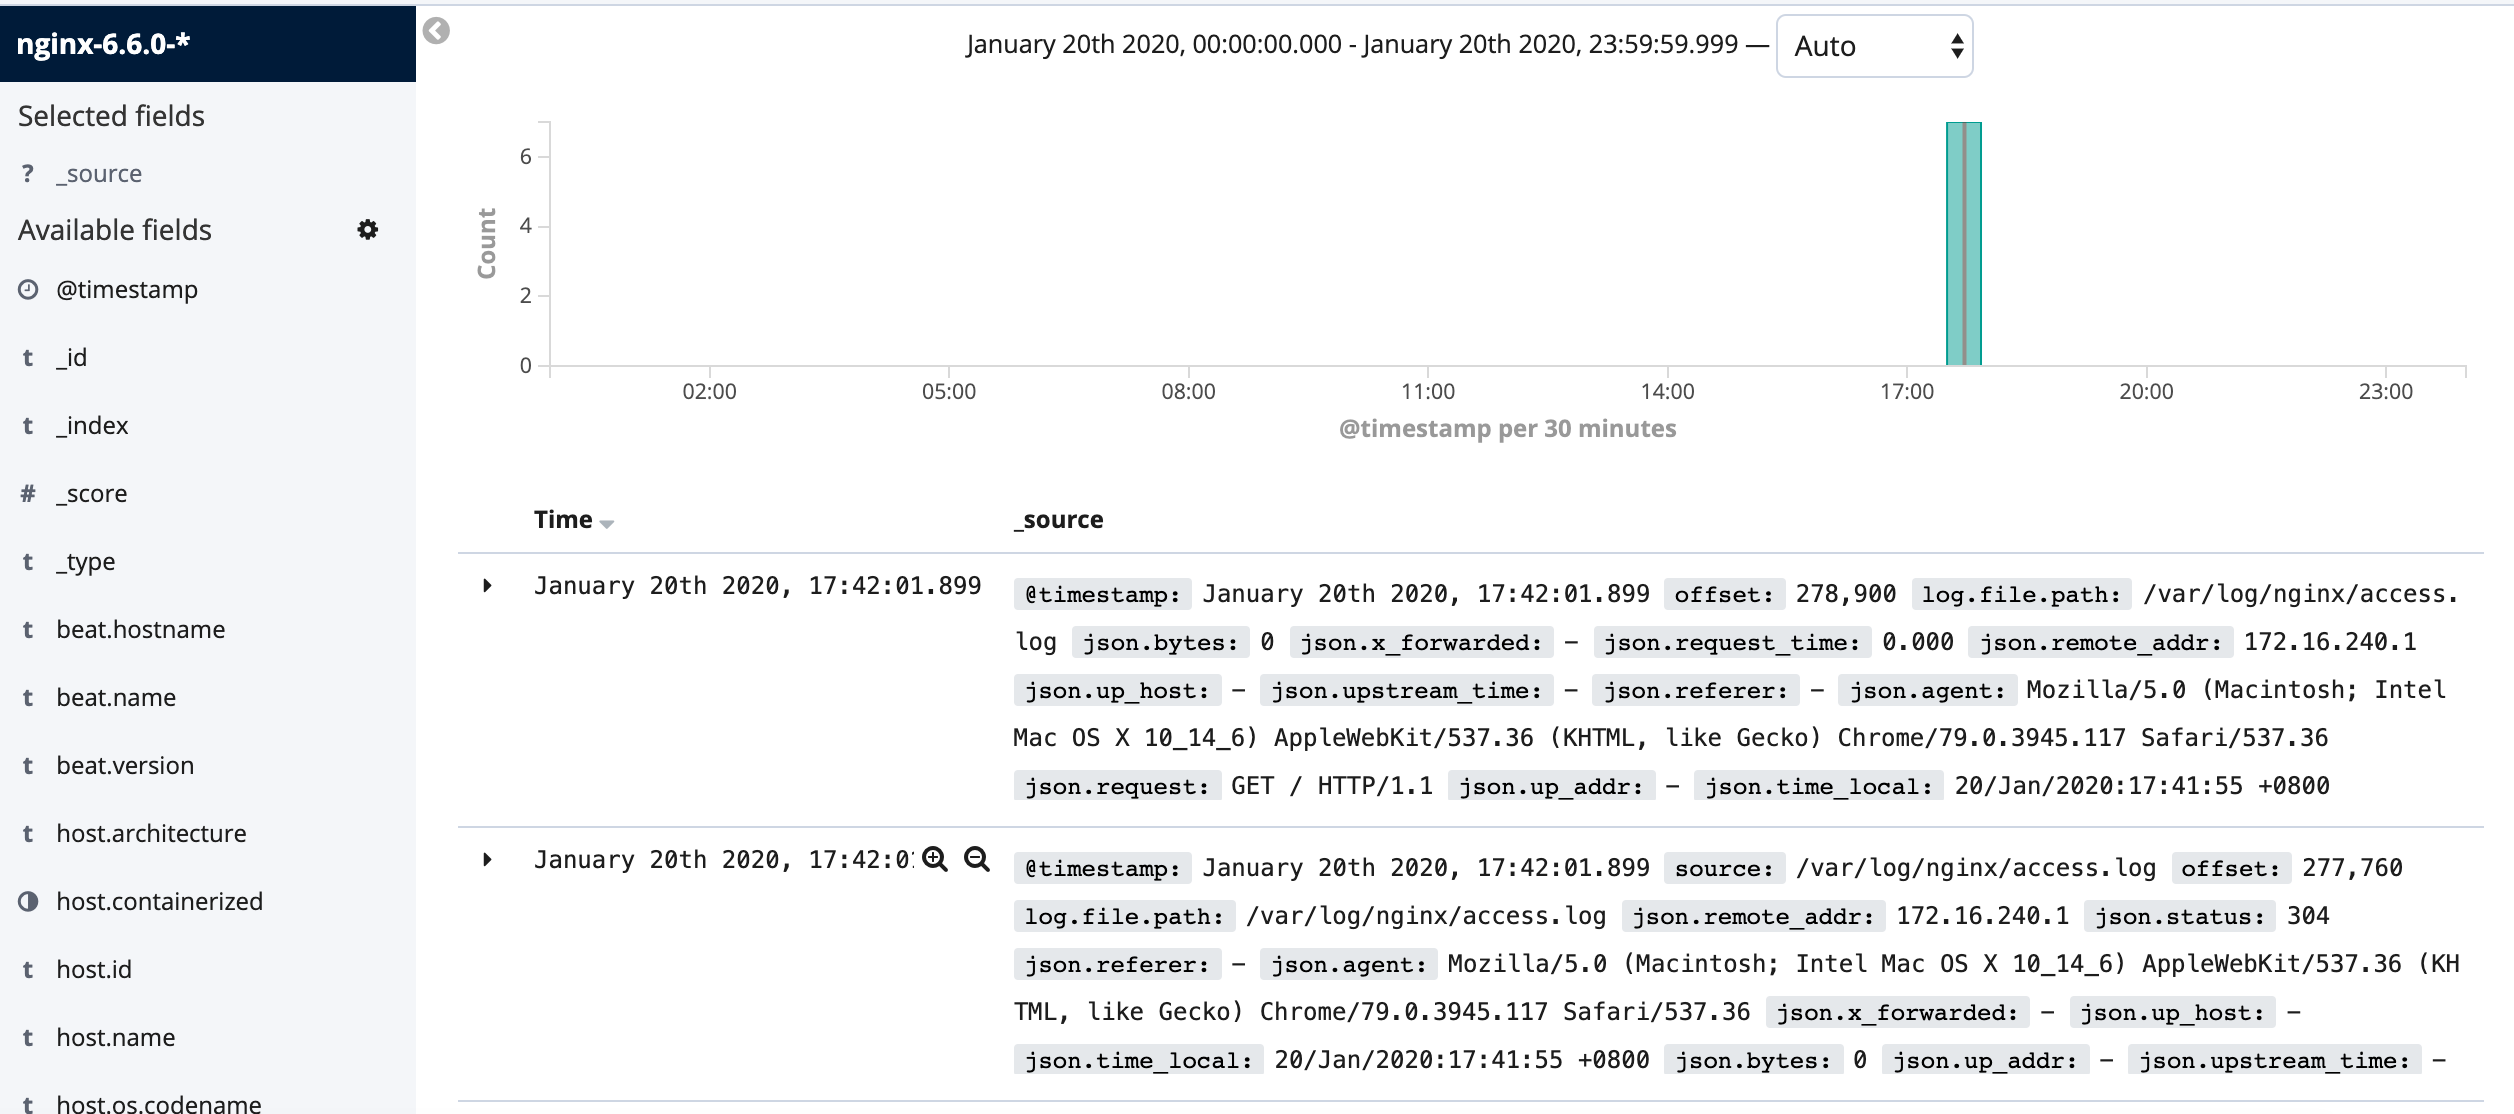
通过kibana 查看
输入
http://172.16.240.70:5601/
收集nginx日志
初级版
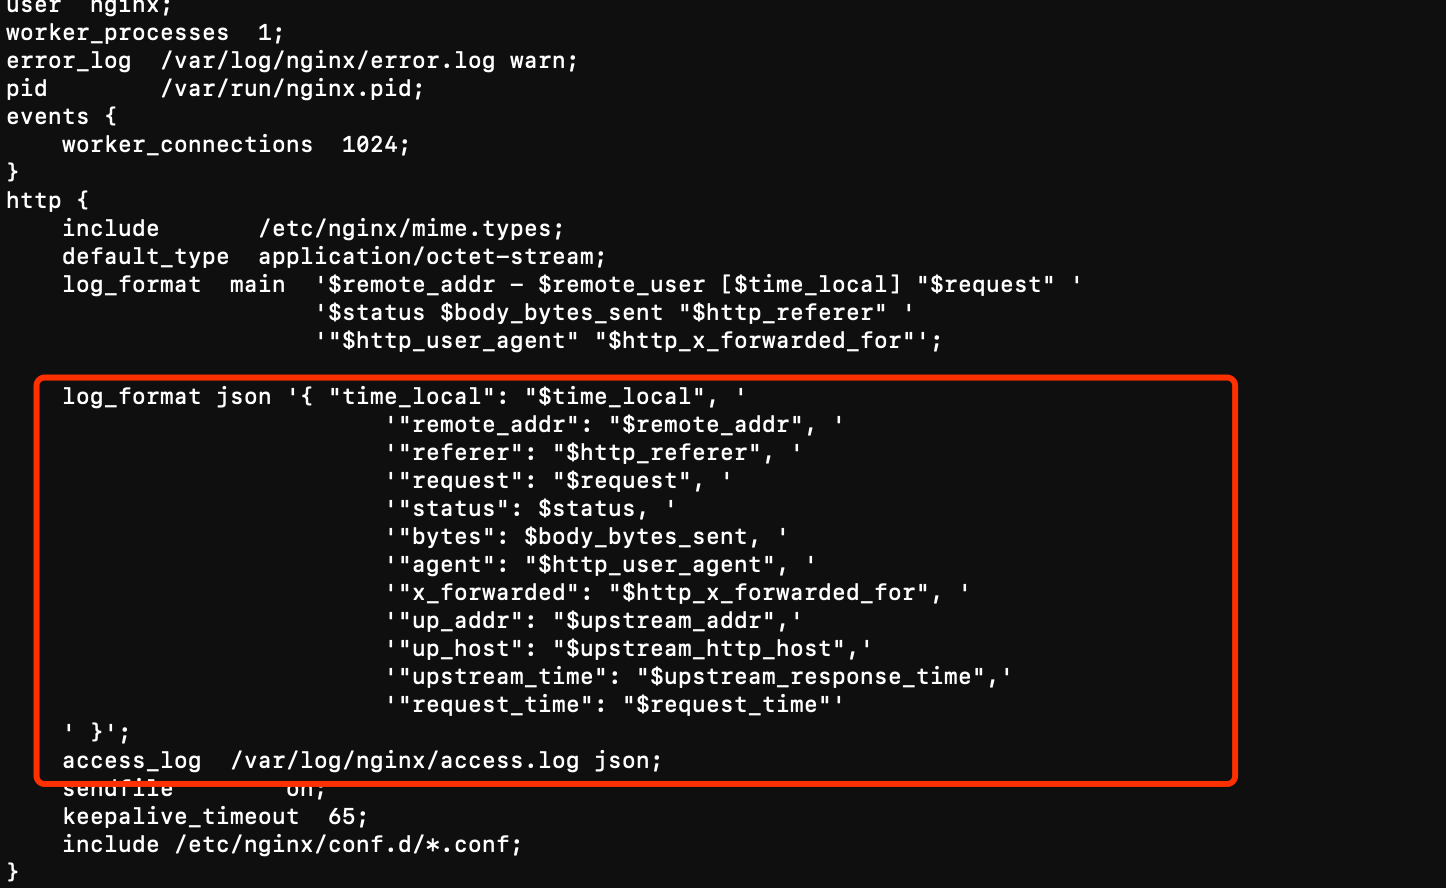
第一步: nginx配置json日志格式
log_format json '{ "time_local": "$time_local", '
                           '"remote_addr": "$remote_addr", '
                           '"referer": "$http_referer", '
                           '"request": "$request", '
                           '"status": $status, '
                           '"bytes": $body_bytes_sent, '
                           '"agent": "$http_user_agent", '
                           '"x_forwarded": "$http_x_forwarded_for", '
                           '"up_addr": "$upstream_addr",'
                           '"up_host": "$upstream_http_host",'
                           '"upstream_time": "$upstream_response_time",'
                           '"request_time": "$request_time"'
    ' }';
access_log  /var/log/nginx/access.log json;
vim /etc/nginx/nginx.conf
第二步: filebeat配置
- 配置json解析
json.keys_under: true
json.overwrite_keys: true
- 配置自定义索引名字
output.elasticsearch:
  hosts: ["172.16.240.60:9200"]
  index: "nginx-%{[beat.version]}-%{+yyyy.MM}"
setup.template.name: "nginx"
setup.template.pattern: "nginx-*"
setup.template.enabled: false
vim /etc/filebeat/filebeat.yml

systemctl restart filebeat
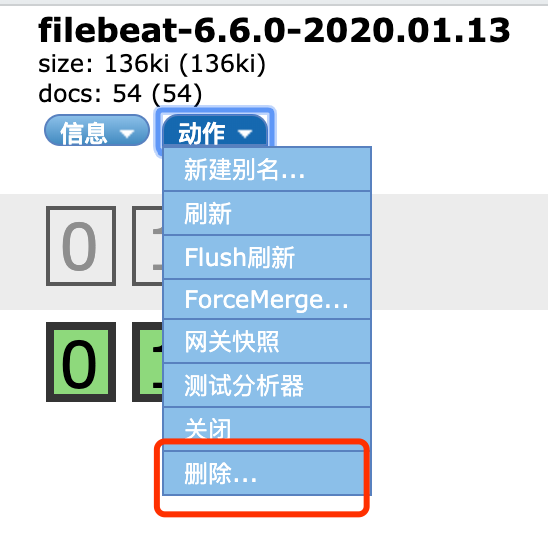
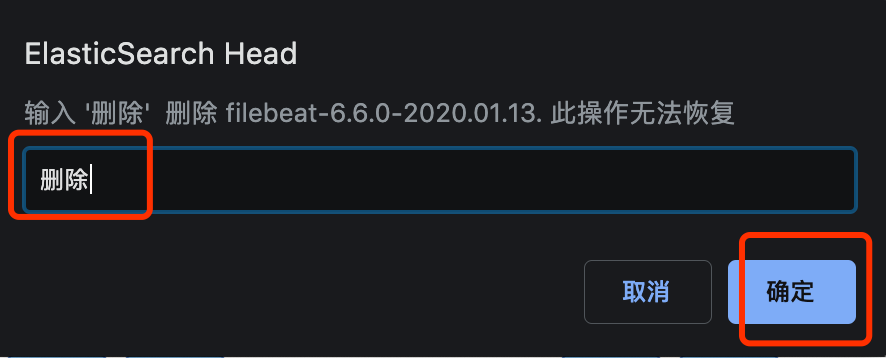
第三步: 清空nginx日志, 重启nginx, 删除原nginx日志产生的索引
- 清空nginx日志, 重启nginx
>/var/log/nginx/access.log
systemctl restart nginx
- 删除原nginx日志产生的索引

- 产生一些日志
ab -n 1000 -c 100 http://172.16.240.80/
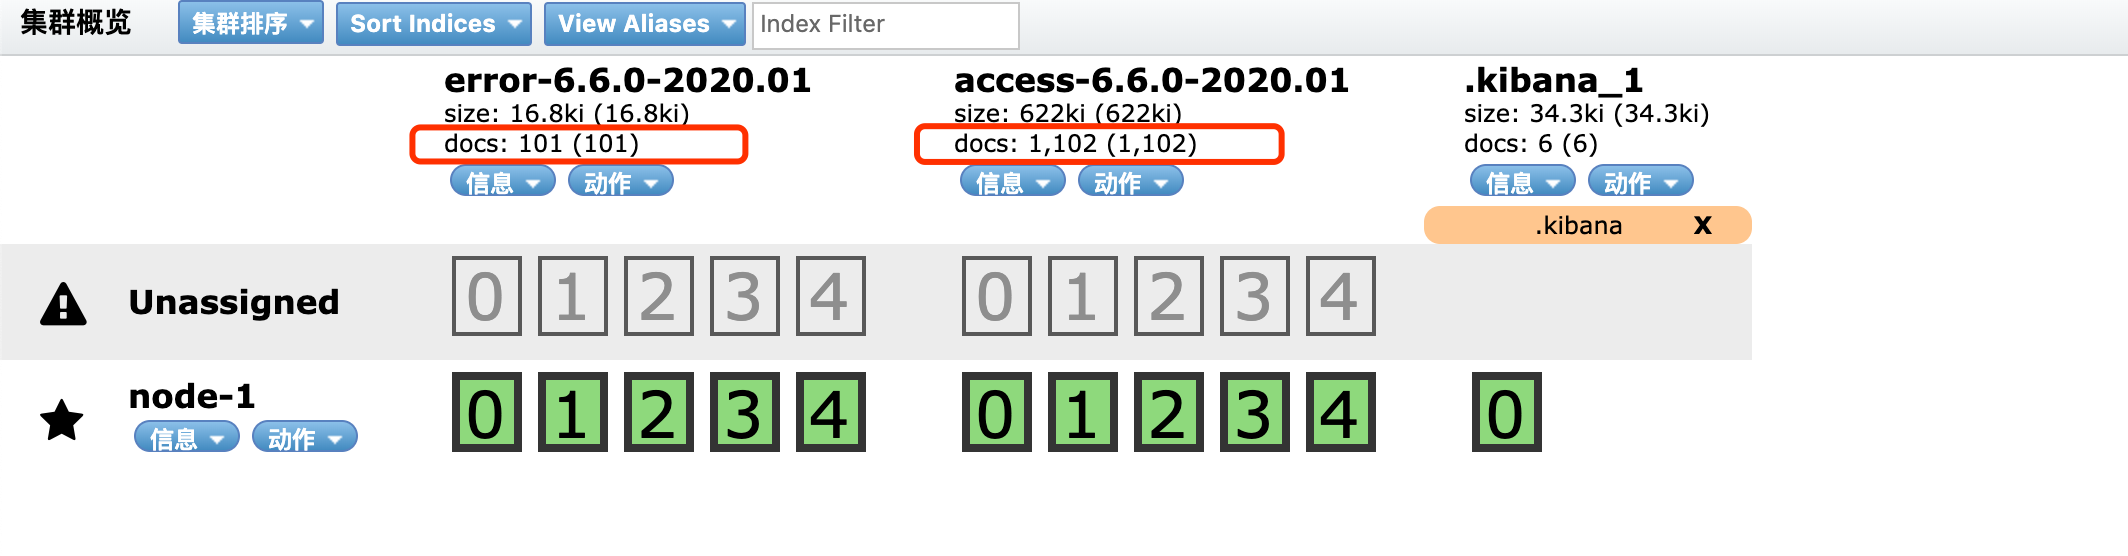
进阶版
收集错误日志, 并且通过2个索引来分别存储错误日志和正确日志
第一步: filebeat配置
filebeat.inputs:

- type: log
  enabled: true
  paths:
    - /var/log/nginx/access.log
  tags: ["access"]
  json.keys_under: true
  json.overwrite_keys: true

- type: log
  enabled: true
  paths:
    - /var/log/nginx/error.log

  tags: ["error"]
  json.keys_under: true
  json.overwrite_keys: true

output.elasticsearch:
  hosts: ["172.16.240.60:9200"]
  #index: "nginx-%{[beat.version]}-%{+yyyy.MM}"
  indices:
    - index: "access-%{[beat.version]}-%{+yyyy.MM}"
      when.contains:
        tags: "access"
    - index: "error-%{[beat.version]}-%{+yyyy.MM}"
      when.contains:
        tags: "error"
参考官方文档 :
https://www.elastic.co/guide/en/beats/filebeat/6.6/filebeat-input-log.html
https://www.elastic.co/guide/en/beats/filebeat/6.6/elasticsearch-output.html
vim /etc/filebeat/filebeat.yml

systemctl restart filebeat.service
第二步:
第三步: 清空nginx日志, 重启nginx, 删除原nginx日志产生的索引
- 清空nginx日志, 重启nginx
>/var/log/nginx/access.log
systemctl restart nginx
- 删除原nginx日志产生的索引
- 产生一些日志
ab -n 1000 -c 100 http://172.16.240.80/
ab -n 100 -c 100 http://172.16.240.80/lyysb
收集tomcat日志
第一步: 配置tomcat 的json日志格式
pattern="{"clientip":"%h","ClientUser":"%l","authenticated":"%u","AccessTime":"%t","method":"%r","status":"%s","SendBytes":"%b","Query?string":"%q","partner":"%{Referer}i","AgentVersion":"%{User-Agent}i"}"
vim /etc/tomcat/server.xml

- 为了验证方便, 清空tomcat日志
> /var/log/tomcat/localhost_access_log.2020-01-21.txt
systemctl restart tomcat
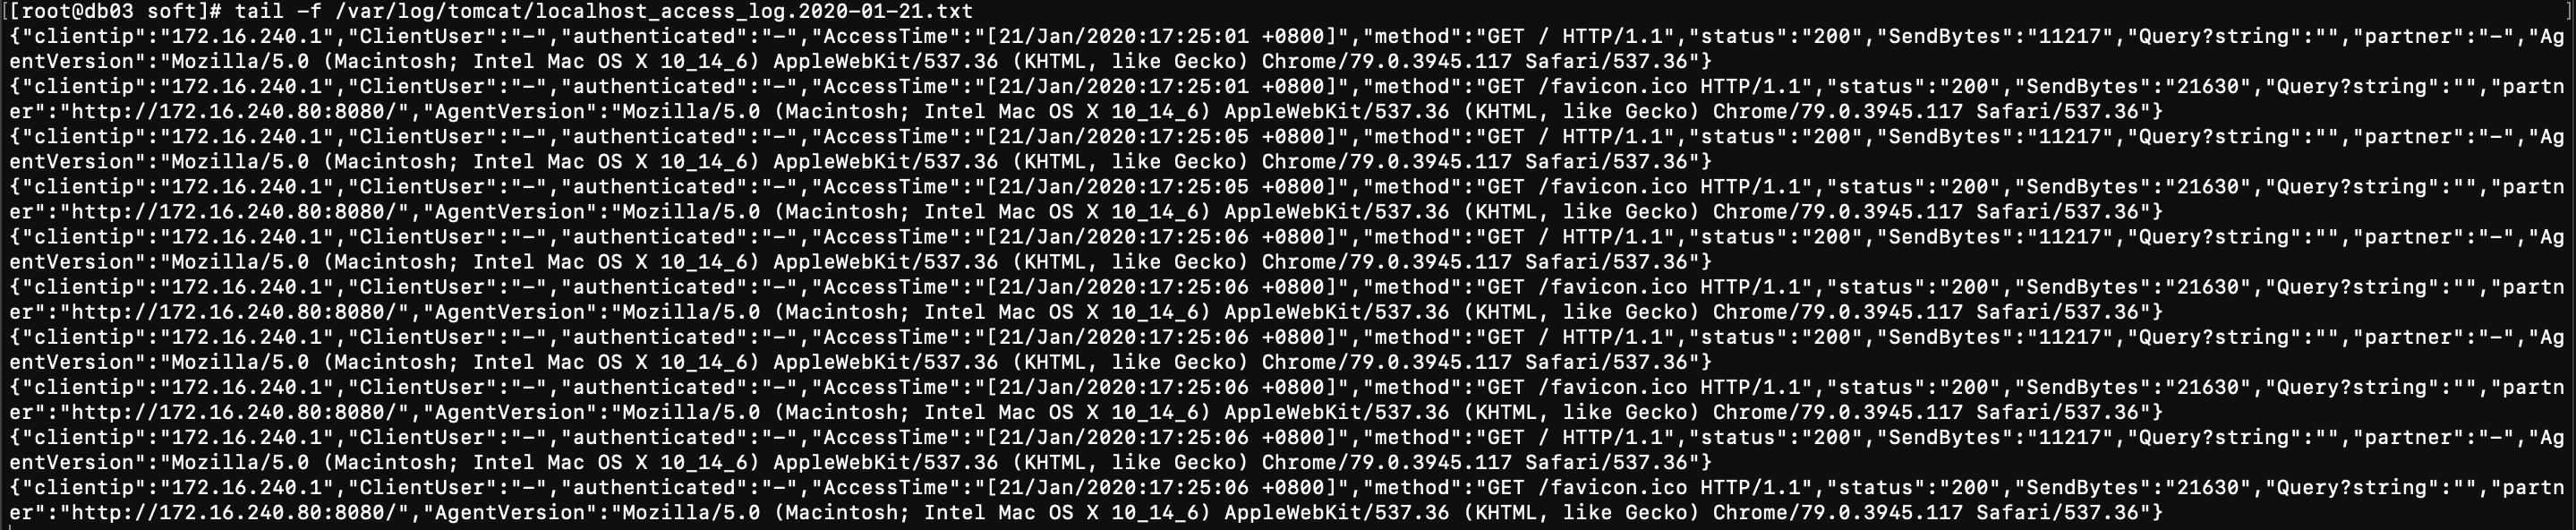
- 查看tomcat日志
tail -f /var/log/tomcat/localhost_access_log.2020-01-21.txt
第二步: 配置filebeat
vim /etc/filebeat/filebeat.yml

systemctl restart filebeat.service

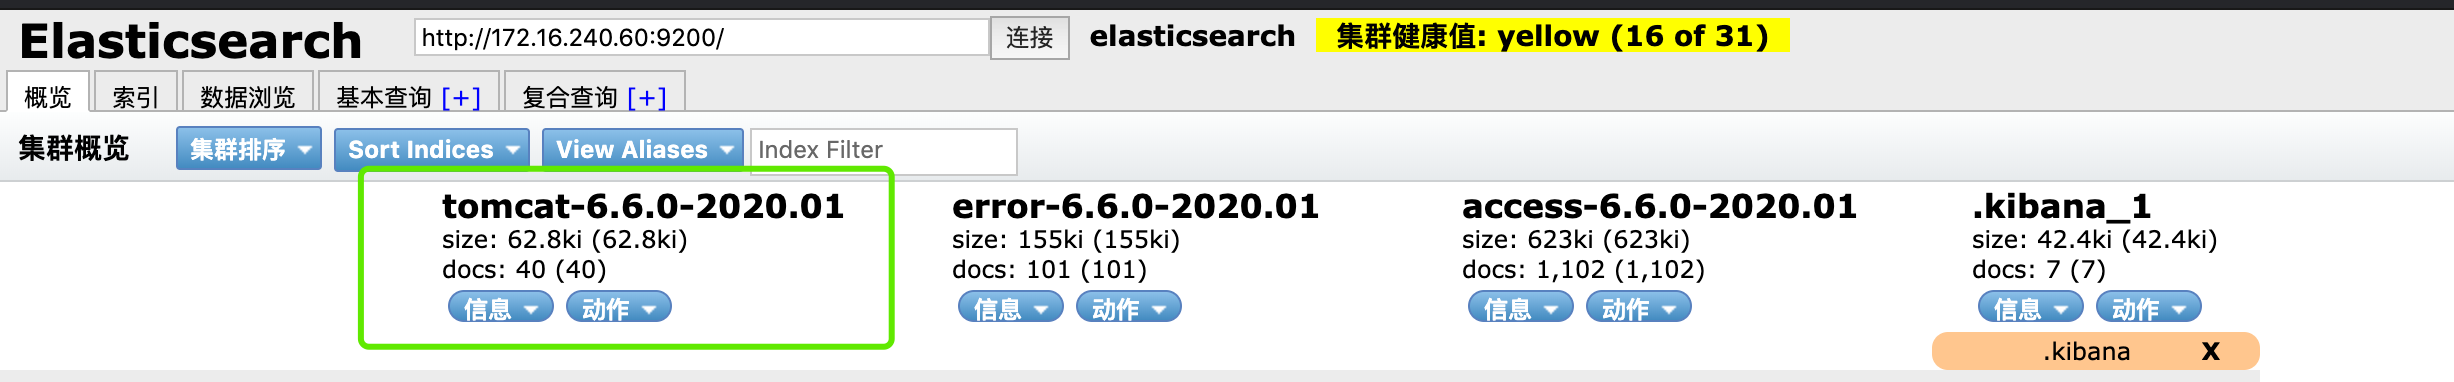
- 验证是否数据是否存入elasticsearch
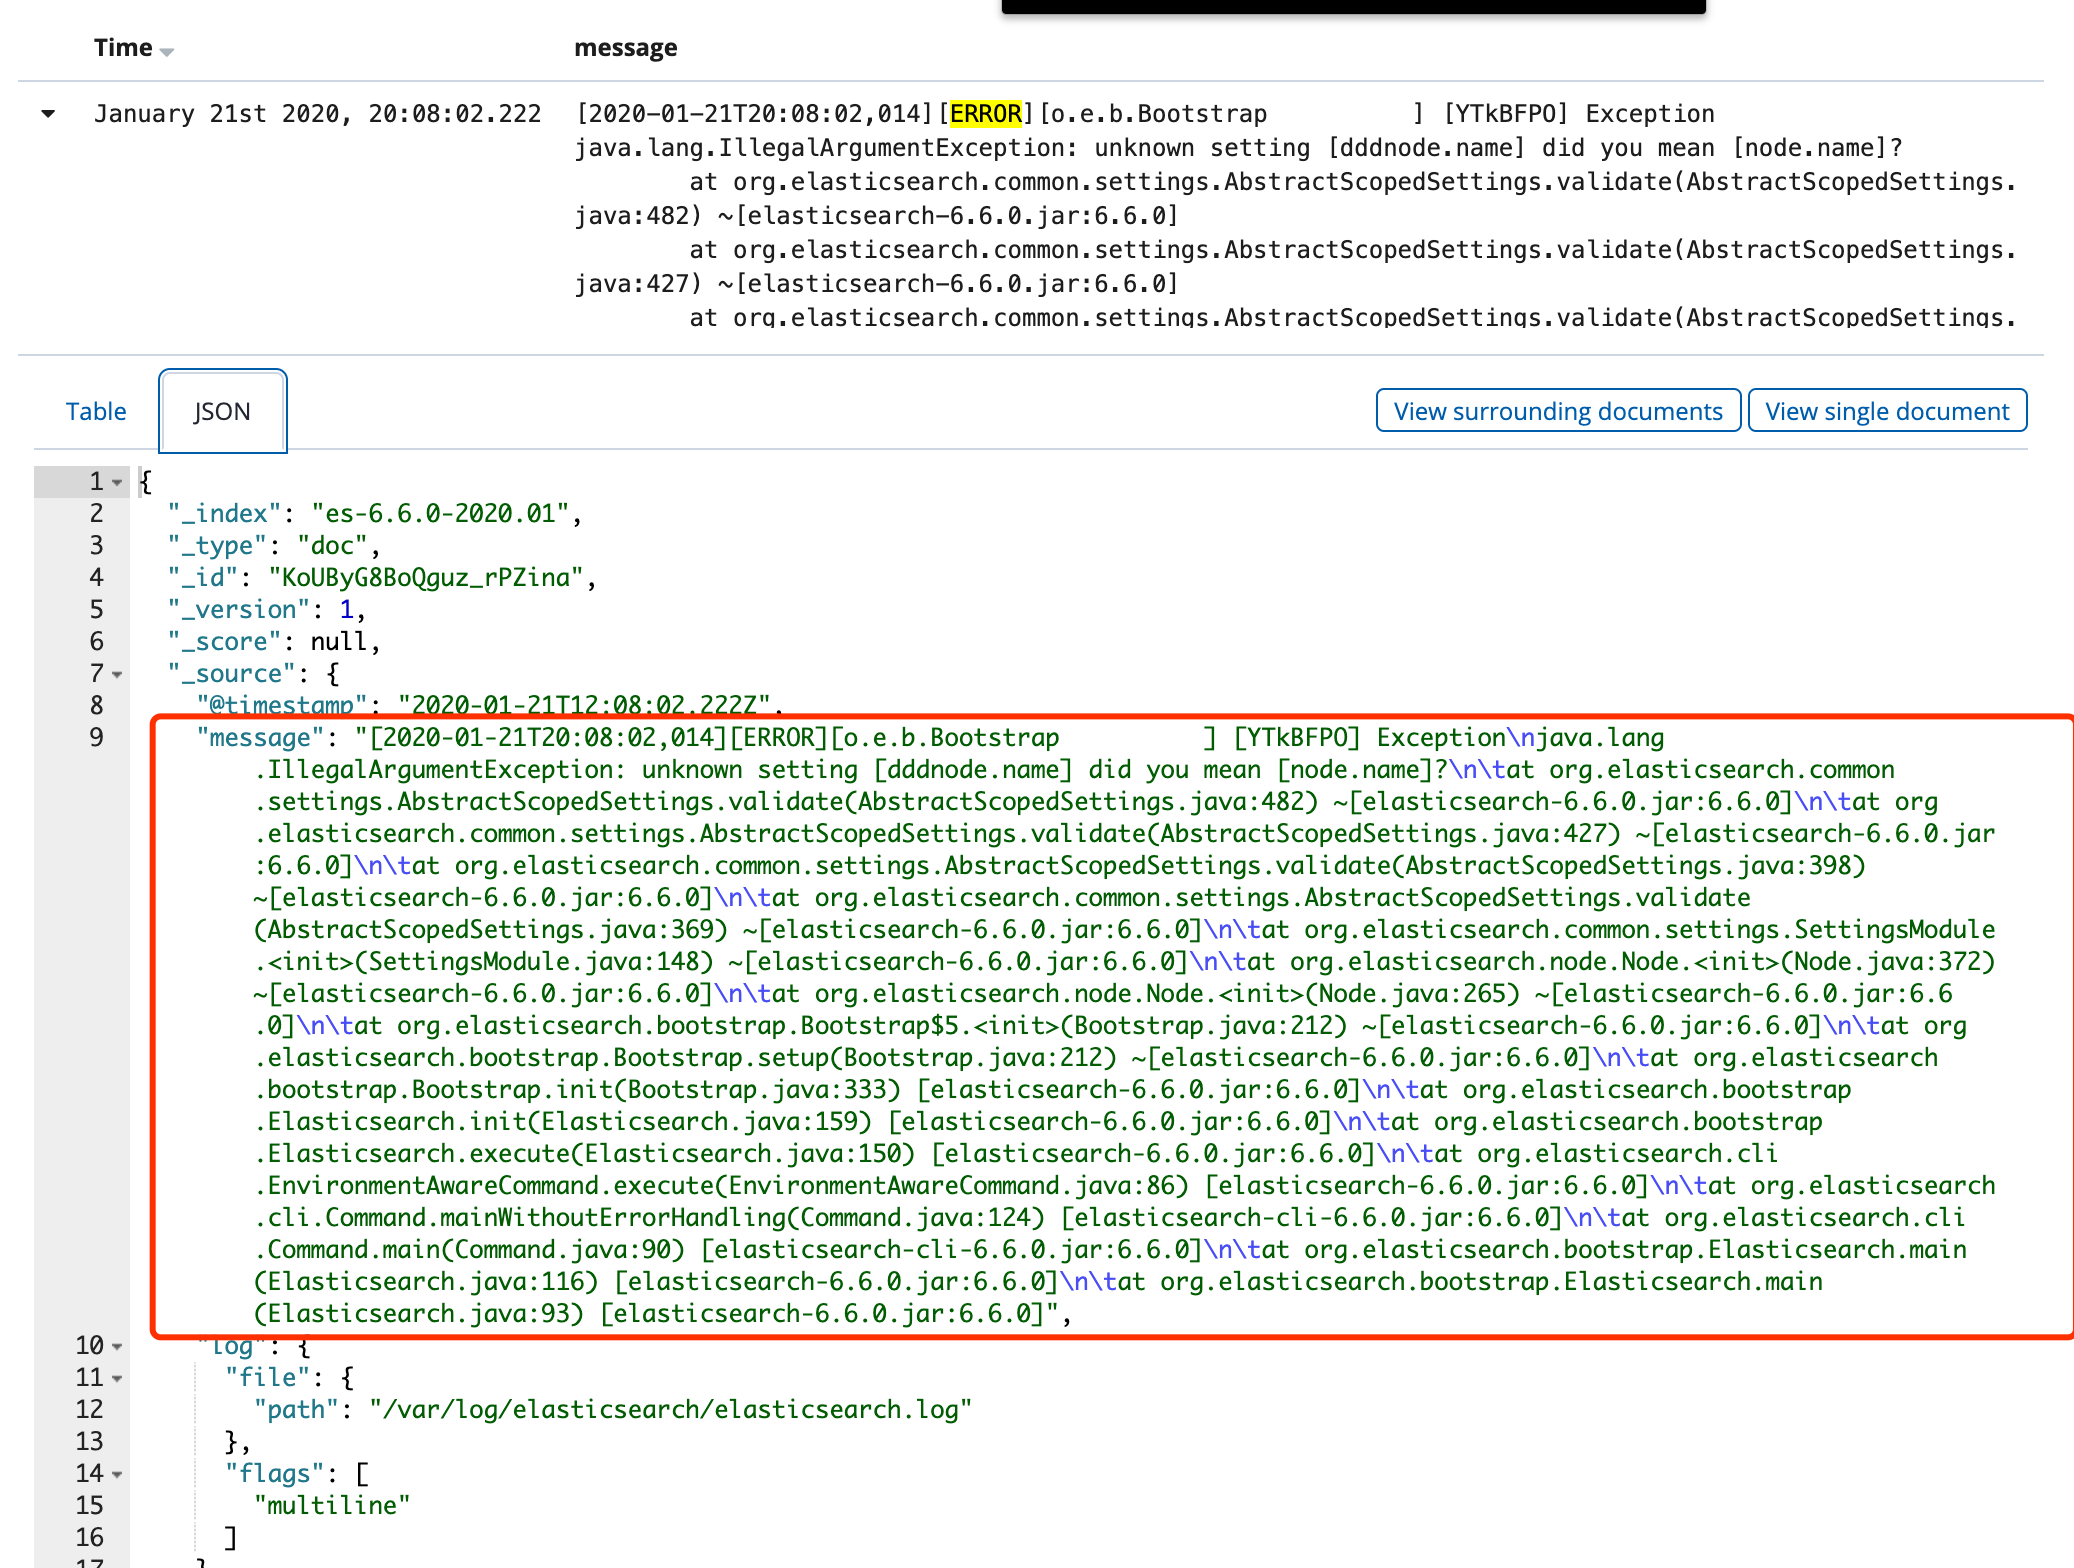
收集elasticsearch日志
参考文档
https://www.elastic.co/guide/en/beats/filebeat/6.6/multiline-examples.html
第一步: 配置filebeat
vim /etc/filebeat/filebeat.yml

systemctl restart filebeat.service
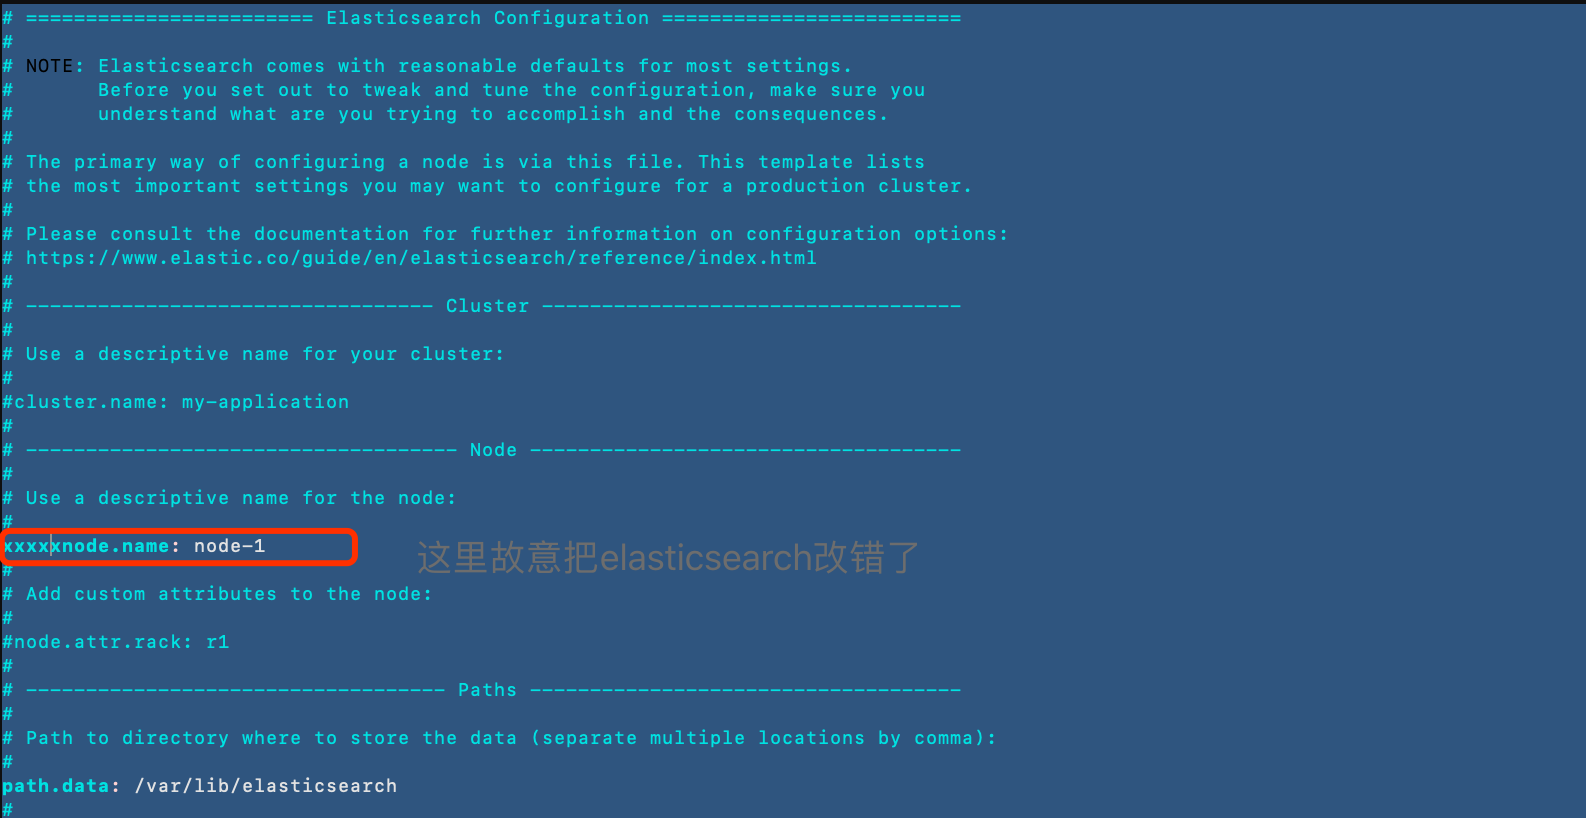
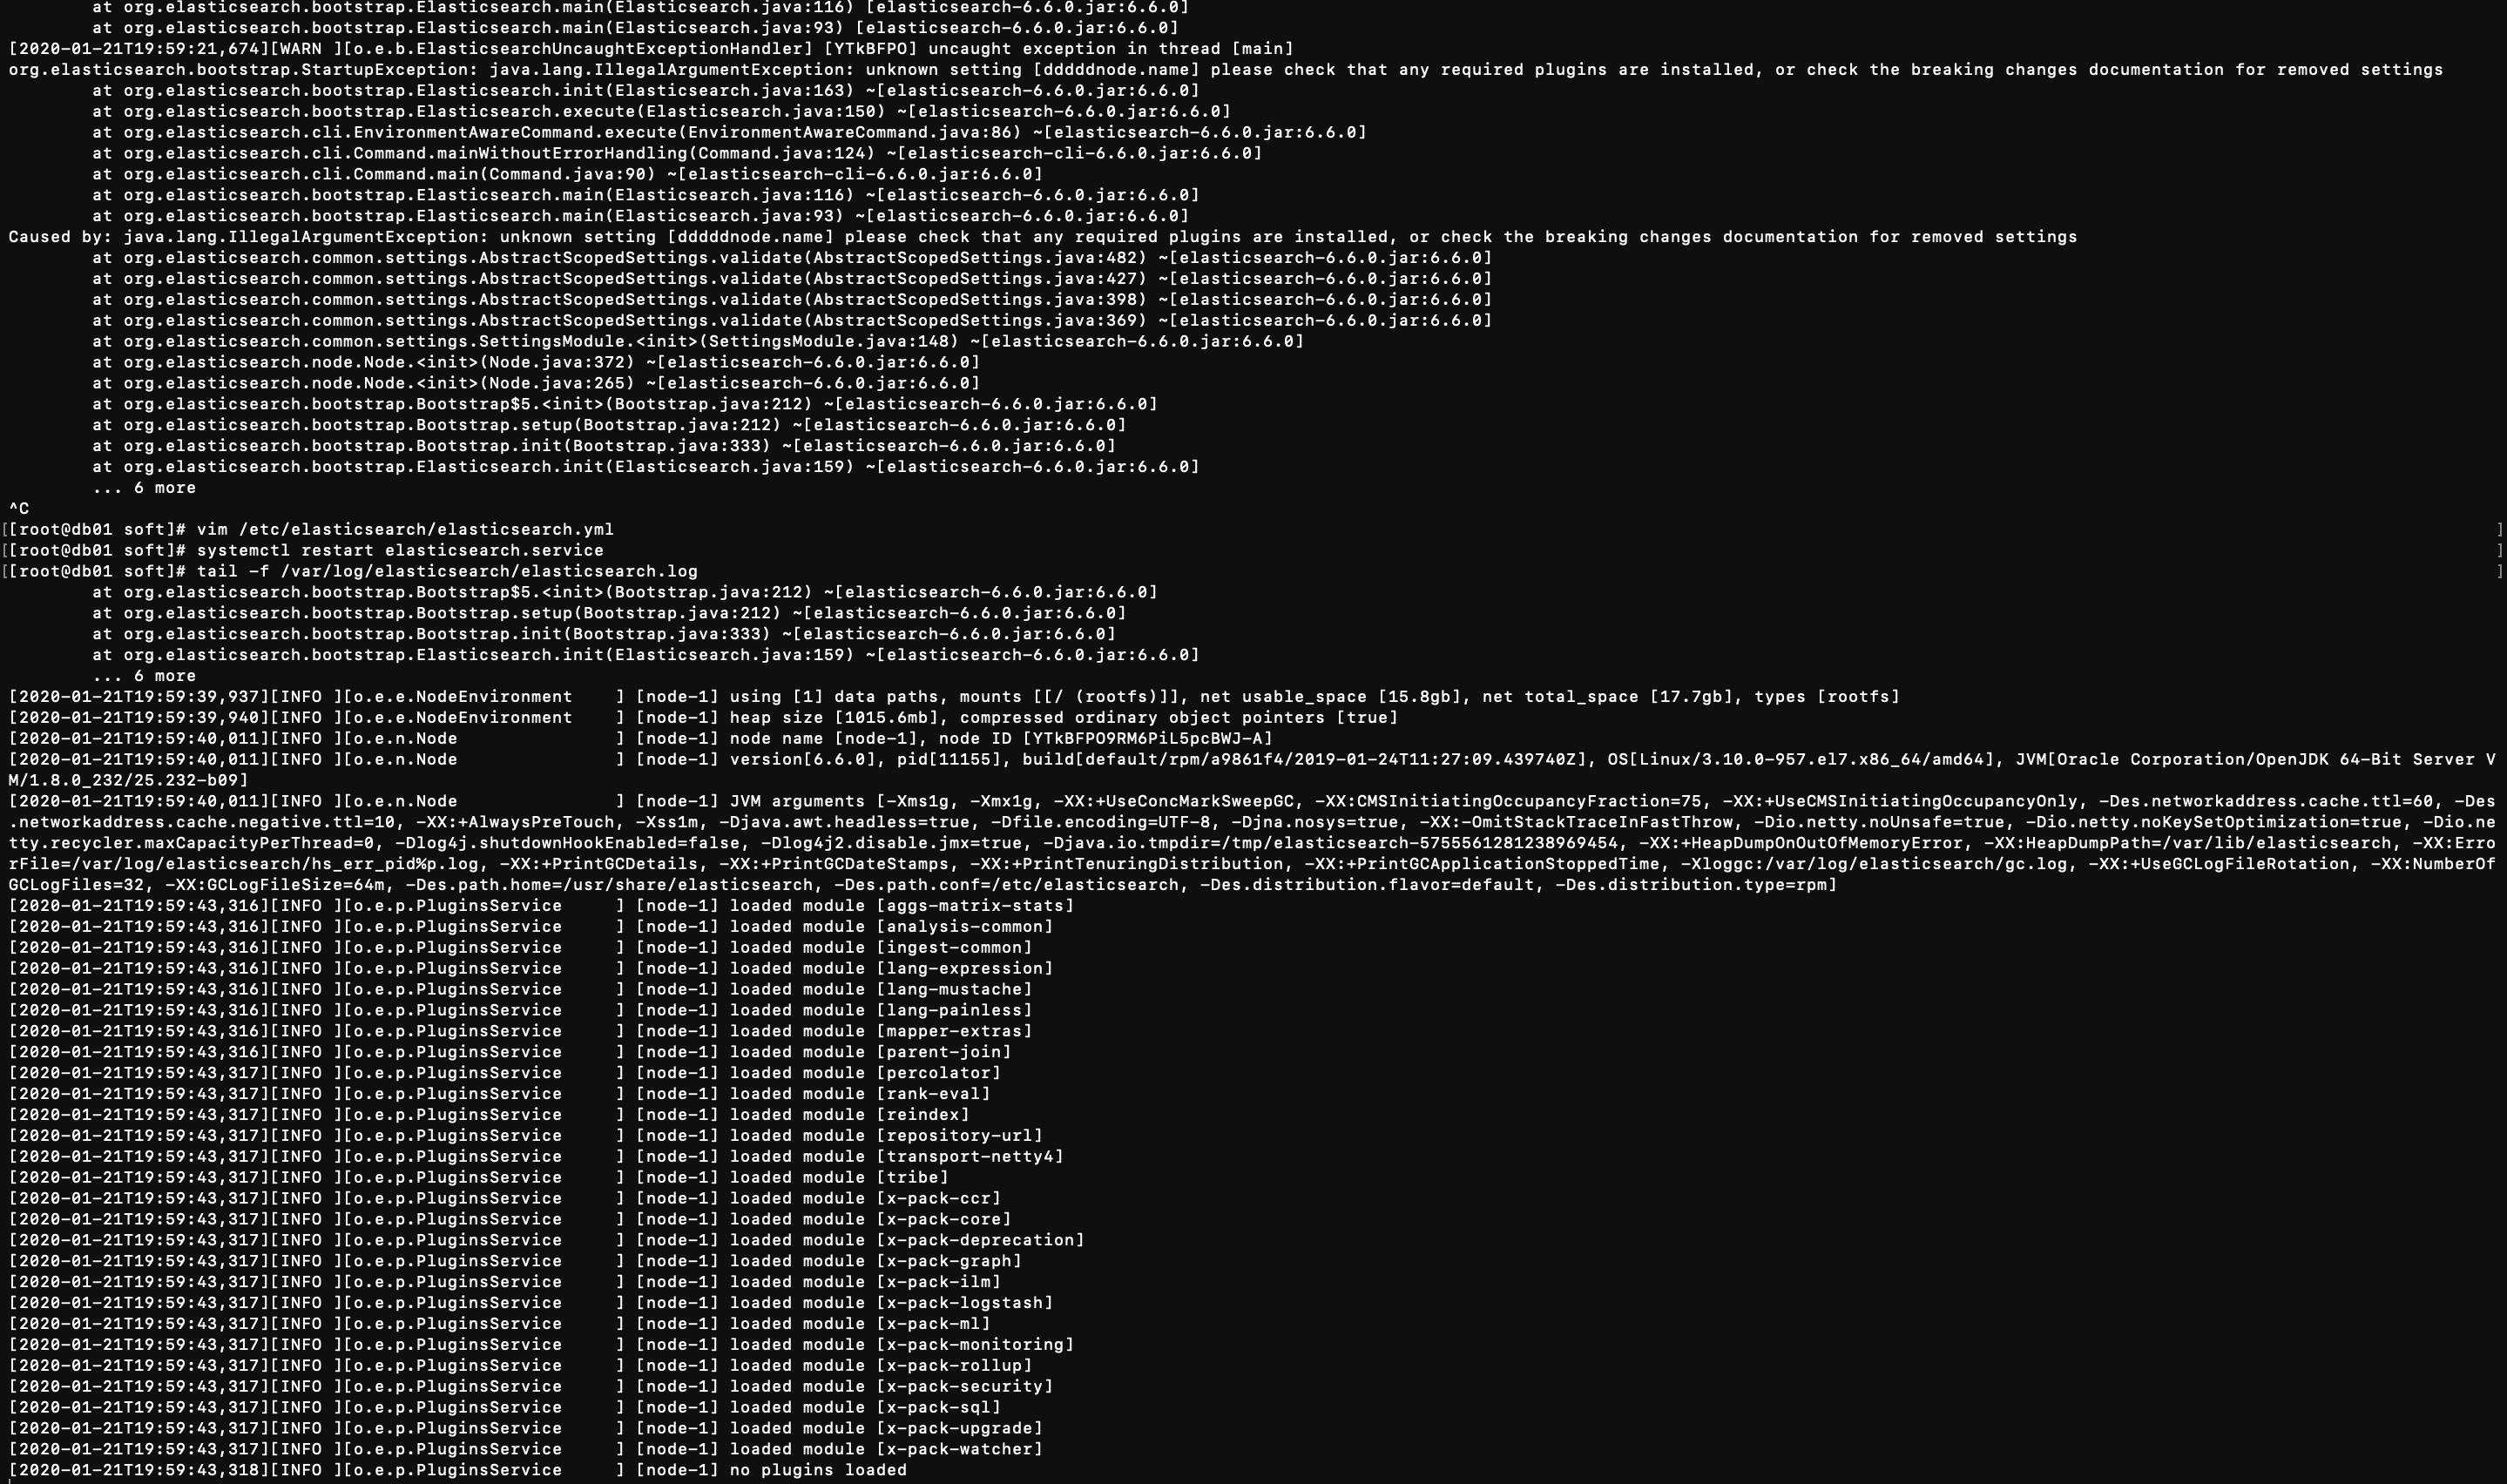
第二步: 制造elasticsearch错误日志
将配置文件改错重启elasticsearch, 然后改回来再重启elasticsearch
vim /etc/elasticsearch/elasticsearch.yml
- 重启服务
systemctl restart elasticsearch.service
- 再把配置文件改回来, 重启服务
vim /etc/elasticsearch/elasticsearch.yml
systemctl restart elasticsearch.service
- 查看elasticsearch日志
tail -f /var/log/elasticsearch/elasticsearch.log
第三步: 查看结果
打开 kibana http://172.16.240.70:5601/