Part 03 The kernel
关于Kernel的链接地址和运行地址
- OS 习惯于linked and run at 高地址,把低地址留给user program
- 利用processor 的memory management hardware 实现物理地址(load address)到虚拟地址(link address)的映射
Exercise 07
-
首先运行到kernel入口处,查询kernel发现入口地址为 0x0010000c(物理地址,即加载地址) ,
调试断点的地址是物理地址而非虚拟地址
-
然后si 直到下一步执行
movl %eax, %cr0-
执行前:0x100000 后面有指令,但是0xf0100000 没有
-
执行后:都有,因为此时已经完成了虚拟地址到物理地址的映像

-
※:不知道为什么,断点设置在0x100000 处不行(???)
0x100000处的反汇编代码如下
.globl entry
entry:
	movw	$0x1234,0x472			# warm boot
f0100000:	02 b0 ad 1b 00 00    	add    0x1bad(%eax),%dh
f0100006:	00 00                	add    %al,(%eax)
f0100008:	fe 4f 52             	decb   0x52(%edi)
f010000b:	e4                   	.byte 0xe4

f010000c <entry>:
f010000c:	66 c7 05 72 04 00 00 	movw   $0x1234,0x472
补充知识:cr0
- cr0全称是control register 0.

-
把eax赋给cr0时,eax=0x80110001,对应上面的标志位就能知道发出了什么控制信息。
-
最关键:
- PG,这个信号打开了页表机制,以后都会自动将 0xf0000000 到 0xf0400000 的虚拟(逻辑)地址转成 0x00000000 到 0x00400000 的物理地址。
- 所以此处会自动把0xf0100000转换成0x00100000,所以两者的值相等。
-
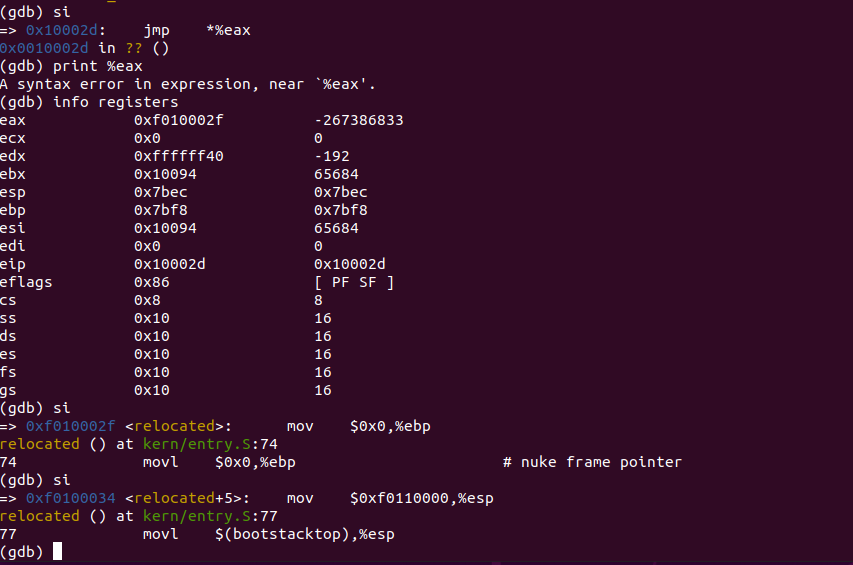
如果注释掉这条语句,那么映射失败。下一条指令是
jmp *%eax此时eax的内容是0xf010002f如果没有映射成功,那会指向这个物理高地址,而不是本应指向的0x100000附近的低地址,就会出错。
Excercise 08
- 参照16进制补充如下:

注:虽然八进制前面需要添加'0',但是参照下面16进制都没有加'0x',所以还是注释掉了(网上有博主说加了之后扣了20分)
问答:
-
第4题中需要用
little-endien和big-endien,资料如下http://www.cnblogs.com/justinzhang/archive/2011/09/29/2195969.html
注意:每个地址存1个字节,2位16进制数是1个字节(0xFF=11111111);
-
其他解答&解析,如下:
Exercise 09
-
在kern/entry.S中找到设置堆栈的关键语句:
relocated: # Clear the frame pointer register (EBP) # so that once we get into debugging C code, # stack backtraces will be terminated properly. movl $0x0,%ebp # nuke frame pointer # Set the stack pointer movl $(bootstacktop),%esp # now to C code call i386_init -
在
movl $0x0,%ebp前后设置断点,检查%ebp和%esp的内容变化Breakpoint 1, relocated () at kern/entry.S:74 74 movl $0x0,%ebp # nuke frame pointer (gdb) info r ... esp 0x7bec 0x7bec ebp 0x7bf8 0x7bf8 ... (gdb) si => 0xf0100034 <relocated+5>: mov $0xf0110000,%esp relocated () at kern/entry.S:77 77 movl $(bootstacktop),%esp (gdb) info r ... esp 0x7bec 0x7bec ebp 0x0 0x0 ... (gdb) si => 0xf0100039 <relocated+10>: call 0xf01000aa <i386_init> 80 call i386_init (gdb) info r ... esp 0xf0110000 0xf0110000 <entry_pgtable> ebp 0x0 0x0 ... -
结论:
-
这两个指令分别设置了%ebp,%esp两个寄存器的值。其中%ebp被修改为0。%esp则被修改为bootstacktop的值。这个值为0xf0110000。另外在entry.S的末尾还定义了一个值,bootstack。注意,在数据段中定义栈顶bootstacktop之前,首先分配了KSTKSIZE这么多的存储空间,专门用于堆栈,这个KSTKSIZE = 8 * PGSIZE = 8 * 4096 = 32KB。所以用于堆栈的地址空间为 0xf0108000-0xf0110000,其中栈顶指针指向0xf0110000. 那么这个堆栈实际坐落在内存的 0x00108000-0x00110000物理地址空间中。
-
内核如何给堆栈保留空间?
在entry.S中的数据段里面声明一块大小为32Kb的空间作为堆栈使用。从而为内核保留了一块空间。
-
堆栈指针指向哪一端?
堆栈由于是向下生长的,所以堆栈指针自然要指向最高地址了。最高地址就是我们之前看到的bootstacktop的值。所以将会把这个值赋给堆栈指针寄存器。
- 注意:
%esp存储的是当前堆栈的顶部,也就是说这里新加入的元素放在更低的位置;%ebp存储的是每个function加入堆栈时的esp值,可以用来trace back
- 注意:
-
Exercise 10
- 在obj/kern/kernel.asm中找到test_traceback函数的地址(0xf0100040),然后设置断点
(gdb) b *0xf0100040
Breakpoint 2 at 0xf0100040: file kern/init.c, line 13.
(gdb) c
Continuing.
=> 0xf0100040 <test_backtrace>:	endbr32

Breakpoint 2, test_backtrace (x=5) at kern/init.c:13
13	{
(gdb) info r
...
esp            0xf010ffdc          0xf010ffdc
ebp            0xf010fff8          0xf010fff8
...

(gdb) c
Continuing.
=> 0xf0100040 <test_backtrace>:	endbr32

Breakpoint 2, test_backtrace (x=4) at kern/init.c:13
13	{
(gdb) info r
...
esp            0xf010ffbc          0xf010ffbc
ebp            0xf010ffd8          0xf010ffd8
...
-
结论
esp ebp test_backtrace(5) 0xf010ffdc 0xf010fff8 test_backtrace(4) 0xf010ffbc 0xf010ffd8 test_backtrace(3) 0xf010ff9c 0xf010ffb8 test_backtrace(2) 0xf010ff7c 0xf010ff98 test_backtrace(1) 0xf010ff5c 0xf010ff78 - 在test_backtrace(5)中调用test_backtrace(4),所以调用后内存中会同时存在二者的栈帧,test_backtrace(4)的栈帧就在test_backtrace(5)的栈帧之后。
Exercise 11
-
printf("%08x",number) 输出8位16进制数,注意这里有little-endien 和 big-endien 的区别
-
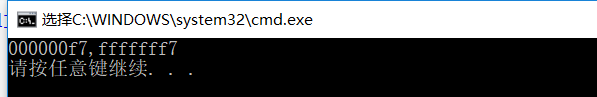
经典例题:下面程序输出的结果是多少?
#include<stdio.h>
int main()
{
	unsigned int a = 0xFFFFFFF7;
   	unsigned char i = (unsigned char)a;
	char* b = (char*)&a;
	printf("%08x,%08x
",i,*b);
	return 0;
}
-
-
为什么可以直接ebp+4?
因为ebp是一个寄存器,但这个寄存器不是只有一个位置只能存放刚好1个数据,而是可以将数据按顺序存入ebp寄存器中
-
为了捋顺关系,搞清楚为什么
eip=*((unsigned int *)(ebp+4)),写了一个模拟程序#include <iostream> using namespace std; int main() { unsigned int ebp, eip; ebp = 0x0; // eip = *((unsigned int*)(ebp + 4)); unsigned int* tmp = ((unsigned int*)(ebp + 4)); //tmp 本身就是一个指针,现在是想要知道这个指针所指的地方存的内容 cout << "&ebp=" << &ebp << " ,ebp=" << ebp << " ,ebp + 4=" << ebp + 4; cout << " (unsigned int*)(ebp+4)=" << (unsigned int*)(ebp + 4); cout << " ((unsigned int*)(ebp + 4))= tmp , *tmp= " << *tmp; //所以这里应该是*tmp,而非&tmp(是取tmp的地址) system("pause"); return 0; } -
eip=*((unsigned int *)(ebp+4))-
ebp 是 unsigned int 类型的int,而非指针,所以把ebp里面的内容保存
-
然后ebp+4 就是真的地址的数字值+4,然后在转化为(unsigned int*)。因为本质上ebp里面装的就是地址,现在把数据类型转化为地址,也就是指向了ebp之前存的地址偏移了4个字节的地址(即+32-bit)
-
因为:unsigned int 长度为32位,而地址按字节寻址,那么ebp+4,相当于后移32位,即存储下一个unsigned int 的地方
-
等价于:
unsigned int *p=ebp;
eip=*((unsigned int *)(ebp+4)) = p+1;
-
-
-
-
填补代码:
- 错误复杂版本
int mon_backtrace(int argc, char **argv, struct Trapframe *tf) { // Your code here. cprintf("stack backtrace: "); unsigned int ebp, esp, eip; unsigned int args[5];//参数数组 ebp=read_ebp();//读出当前ebp内容,当ebp为0时结束 //从顶层往最底层(最初)开始读取 while(ebq) { eip=*((unsigned int*)(ebp+4)); for(int i=0;i<5;i++) args[i] = *((unsigned int*)(ebp+8+4i)); cprintf("ebp %08x eip %08x args %08x %08x %08x %08x %08x ", ebp,eip,args[1],args[2],args[3],args[4],args[5]); ebp=*((unsigned int*)ebp);//取ebp值所代表的地址的值 } return 0; }- 修改版本
int
mon_backtrace(int argc, char **argv, struct Trapframe *tf)
{
	// Your code here.
	cprintf("stack backtrace:
");
	unsigned int ebp,*p;
	ebp=read_ebp();//读出当前ebp内容,当ebp为0时结束
	//从顶层往最底层(最初)开始读取
	while(ebp)
	{
	  p=(unsigned int *)ebp;
	  cprintf("ebp %08x  eip %08x  args %08x %08x %08x %08x %08x
", ebp,p[1],p[2],p[3],p[4],p[5],p[6]);
	  ebp=*((unsigned int*)ebp);//取ebp值所代表的地址的值
	}
	return 0;
}
函数栈帧:
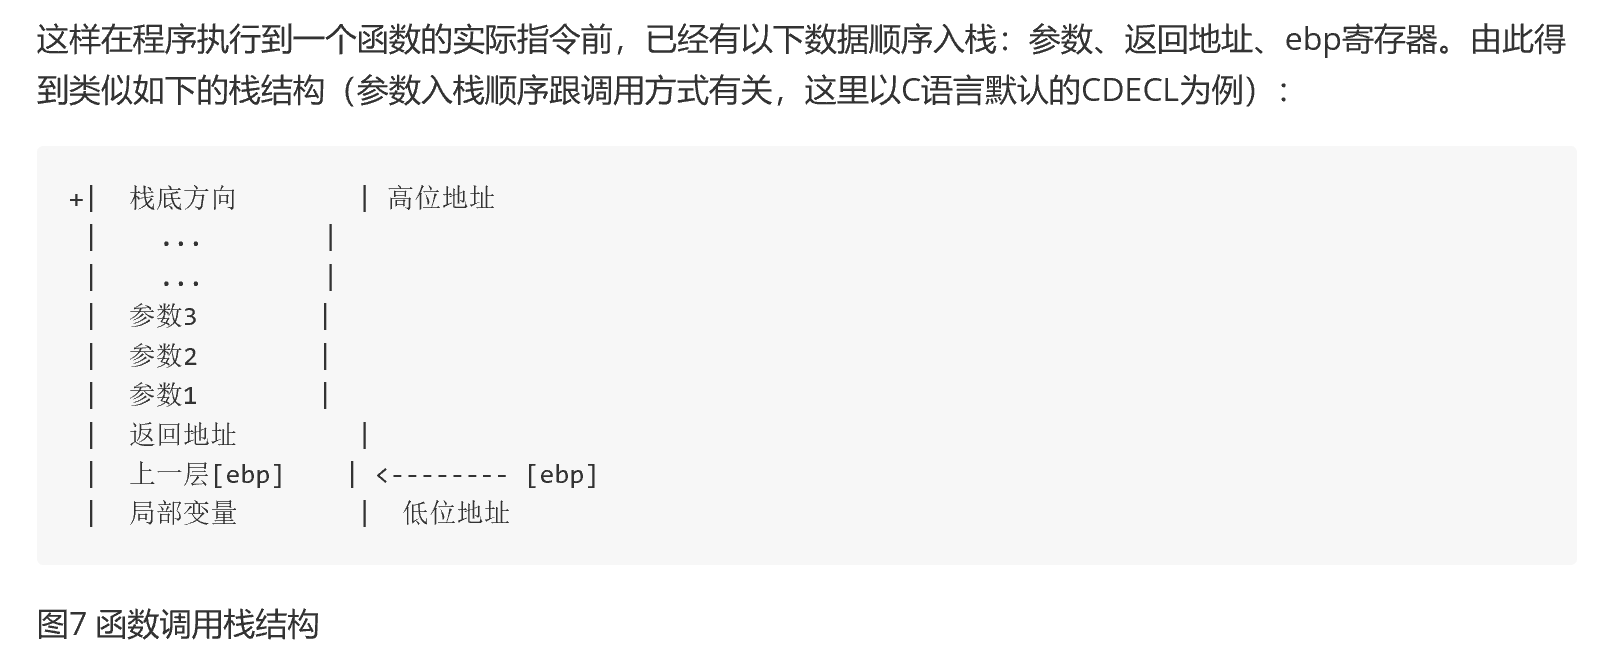
- 这个
返回地址可以理解为这一帧的函数的地址,因为这一帧代表这一个函数被暂时存放入堆栈,ebp是一个指引,代表再上一层函数的堆栈存放地点指引
清华ucore 函数堆栈讲解:
https://objectkuan.gitbooks.io/ucore-docs/content/lab1/lab1_3_3_1_function_stack.html
- 结果:(图里面的FAIL是针对下个练习的)

Exercise 12
- 1.在kern/kdebug.c里面增加代码完善debuginfo_eip函数功能
-
先要理解stabs结构
-
.stabs : 符号表
-
引自:https://www.cnblogs.com/wuhualong/p/lab01_exercise12_print_more_info.html
首先,使用
objdump -G obj/kern/kernel > output.md将内核的符号表信息输出到output.md文件,在output.md文件中可以看到以下片段:Symnum n_type n_othr n_desc n_value n_strx String 118 FUN 0 0 f01000a6 2987 i386_init:F(0,25) 119 SLINE 0 24 00000000 0 120 SLINE 0 34 00000012 0 121 SLINE 0 36 00000017 0 122 SLINE 0 39 0000002b 0 123 SLINE 0 43 0000003a 0这个片段是什么意思呢?首先要理解第一行给出的每列字段的含义:
- Symnum是符号索引,换句话说,整个符号表看作一个数组,Symnum是当前符号在数组中的下标
- n_type是符号类型,
FUN指函数名,SLINE指在text段中的行号 - n_othr目前没被使用,其值固定为0
- n_desc表示在文件中的行号
- n_value表示地址。特别要注意的是,这里只有FUN类型的符号的地址是绝对地址,SLINE符号的地址是偏移量,其实际地址为函数入口地址加上偏移量。比如第3行的含义是地址f01000b8(=0xf01000a6+0x00000012)对应文件第34行。
-
-
仔细理解
kdebug.c发现关键是理解stab_binsearch(...)函数,注解后的代码如下:
int
debuginfo_eip(uintptr_t addr, struct Eipdebuginfo *info)
{
	const struct Stab *stabs, *stab_end;
	const char *stabstr, *stabstr_end;
	int lfile, rfile, lfun, rfun, lline, rline;

	// Initialize *info
	info->eip_file = "<unknown>";
	info->eip_line = 0;
	info->eip_fn_name = "<unknown>";
	info->eip_fn_namelen = 9;
	info->eip_fn_addr = addr;
	info->eip_fn_narg = 0;

	// Find the relevant set of stabs
	if (addr >= ULIM) {
		stabs = __STAB_BEGIN__;
		stab_end = __STAB_END__;
		stabstr = __STABSTR_BEGIN__;
		stabstr_end = __STABSTR_END__;
	} else {
		// Can't search for user-level addresses yet!
  	        panic("User address");
	}

	// String table validity checks
	if (stabstr_end <= stabstr || stabstr_end[-1] != 0)
		return -1;

	// Now we find the right stabs that define the function containing
	// 'eip'.  First, we find the basic source file containing 'eip'.//step01先找到包含eip的文件
	// Then, we look in that source file for the function.  Then we look //step02然后在该文件里找到它的函数
	// for the line number.  //step03然后寻找行编号

	// Search the entire set of stabs for the source file (type N_SO).
	lfile = 0;
	rfile = (stab_end - stabs) - 1;  //stabs 是一系列stabs的集中放置的指示指针
	stab_binsearch(stabs, &lfile, &rfile, N_SO, addr);  //step01,更新 &lfile, &rfile
	if (lfile == 0)
		return -1;

	// Search within that file's stabs for the function definition  第二步
	// (N_FUN).  寻找function
	lfun = lfile;
	rfun = rfile;
	stab_binsearch(stabs, &lfun, &rfun, N_FUN, addr);  //二分查找,更新&lfun, &rfun

	if (lfun <= rfun) {
		// stabs[lfun] points to the function name
		// in the string table, but check bounds just in case.
		if (stabs[lfun].n_strx < stabstr_end - stabstr)
			info->eip_fn_name = stabstr + stabs[lfun].n_strx;
		info->eip_fn_addr = stabs[lfun].n_value;
		addr -= info->eip_fn_addr;//此时addr就是函数内的偏移量
		// Search within the function definition for the line number. //function找到了,在这个范围内确定line
		lline = lfun;
		rline = rfun;
	} else {
		// Couldn't find function stab!  Maybe we're in an assembly
		// file.  Search the whole file for the line number.  //如果找不到function stab说明是在汇编文件里,去寻找line number
		info->eip_fn_addr = addr;
		lline = lfile;
		rline = rfile;
	}
	// Ignore stuff after the colon.
	info->eip_fn_namelen = strfind(info->eip_fn_name, ':') - info->eip_fn_name;


	// Search within [lline, rline] for the line number stab.
	// If found, set info->eip_line to the right line number.
	// If not found, return -1.
	//
	// Hint:
	//	There's a particular stabs type used for line numbers.
	//	Look at the STABS documentation and <inc/stab.h> to find
	//	which one.
	// Your code here.

	stab_binsearch(stabs,&lline,&rline,N_SLINE,addr);
	if(lline <= rline)
	{
	    info->eip_line=stabs[lline].n_desc;
	}
	else
	{
	    cprintf("line not found!
");
	}
※ 最后即为自己添加的代码
int
mon_backtrace(int argc, char **argv, struct Trapframe *tf)
{
	// Your code here.
	cprintf("stack backtrace:
");
	unsigned int ebp,*eip,*p;
	ebp=read_ebp();//读出当前ebp内容,当ebp为0时结束
	eip=(unsigned int *)(ebp+4);
	//从顶层往最底层(最初)开始读取
	struct Eipdebuginfo info;
	int flag = debuginfo_eip(*eip,&info);
	while(ebp)
	{
	  p=(unsigned int *)ebp;
	  cprintf("ebp %08x  eip %08x  args %08x %08x %08x %08x %08x
", ebp,p[1],p[2],p[3],p[4],p[5],p[6]);
	  flag = debuginfo_eip(p[1],&info);
	  if(flag ==0)
	  {
	      	  cprintf("	%s:%d: %.*s+%d
",info.eip_file,info.eip_line,info.eip_fn_namelen,info.eip_fn_name,(p[1] - info.eip_fn_addr));
	  }
	  ebp=*((unsigned int*)ebp);//取ebp值所代表的地址的值
	}
	return 0;
}
- 2. 在内核模拟器里面添加backtrace命令
static struct Command commands[] = {
	{ "help", "Display this list of commands", mon_help },
	{ "kerninfo", "Display information about the kernel", mon_kerninfo },
	{ "backtrace", "Display a backtrace of the function stack", mon_backtrace },
    //最后一句是自己添加的
};
两个问题:
- debuginfo_eip函数的参数不应该是ebp而是eip ——>没有搞清楚ebp和eip的意思
- 去理解函数堆栈,每一个栈帧的含义:
- 最后cprintf里面不是info.eip_fn_addr,而是偏移量——eip-info.eip_fn_addr
info.eip_fn_addr是函数的起始位置,而eip是整体的指令地址,所以eip — info.eip_fn_addr是函数内的偏移- 输出格式少了个
: - 本质:没有深层理解函数调用本质:https://www.jianshu.com/p/8ec9063a37bd
成功啦啦啦~!


总结
Lab1结束后,物理内存分布如下:
