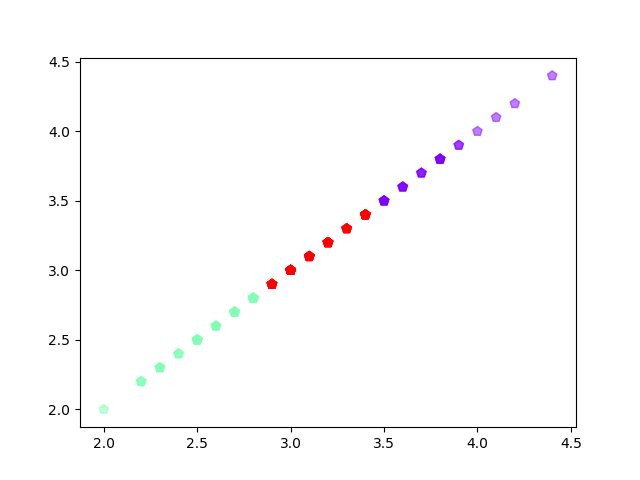
2). *自主编写K-means算法 ,以鸢尾花花瓣长度数据做聚类,并用散点图显示。(加分题)
 1 import numpy as np
 2 from sklearn.datasets import load_iris
 3 import matplotlib.pyplot as plt
 4
 5 iris = load_iris()
 6 x = iris.data[:, 1]     # 鸢尾花花瓣长度数据
 7 y = np.zeros(150)
 8
 9 def initcent(x, k):     # 初始聚类中心数组
10     return x[0:k].reshape(k)
11
12 def nearest(kc, i):  # 数组中的值,与聚类中心最小距离所在类别的索引号
13     d = (abs(kc - i))
14     w = np.where(d == np.min(d))
15     return w[0][0]
16
17 def kcmean(x, y, kc, k):  # 计算各聚类新均值
18     l = list(kc)
19     flag = False
20     for c in range(k):
21         m = np.where(y == c)
22         n = np.mean(x[m])
23         if l[c] != n:
24             l[c] = n
25             flag = True  # 聚类中心发生变化
26     return (np.array(l), flag)
27
28 def xclassify(x, y, kc):
29     for i in range(x.shape[0]):  # 对数组的每个值分类
30         y[i] = nearest(kc, x[i])
31     return y
32
33 k = 3   #3个聚类中心
34 kc = initcent(x, k)
35 flag = True
36 print(x, y, kc, flag)
37 while flag:
38     y = xclassify(x, y, kc)
39     kc, flag = kcmean(x, y, kc, k)
40 print(y, kc, type(kc))
41
42 plt.scatter(x,x,c=y,s=50,cmap='rainbow',marker='p',alpha=0.5);
43 plt.show()
运行结果:
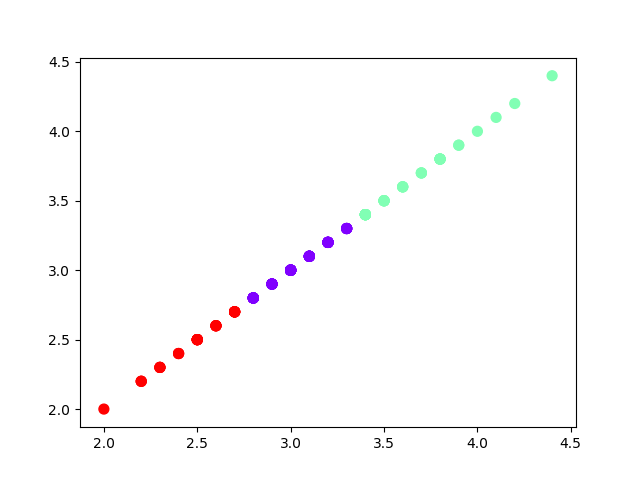
3). 用sklearn.cluster.KMeans,鸢尾花花瓣长度数据做聚类,并用散点图显示.
from sklearn.datasets import load_iris
import matplotlib.pyplot as plt
from sklearn.cluster import KMeans

iris=load_iris()
sl=iris.data[:,1]
X=sl.reshape(-1,1)

est=KMeans(n_clusters=3)
est.fit(X)

y_kmeans=est.predict(X)

plt.scatter(X[:,0],X[:,0],c=y_kmeans,s=50,cmap='rainbow');
plt.show()
实验结果:
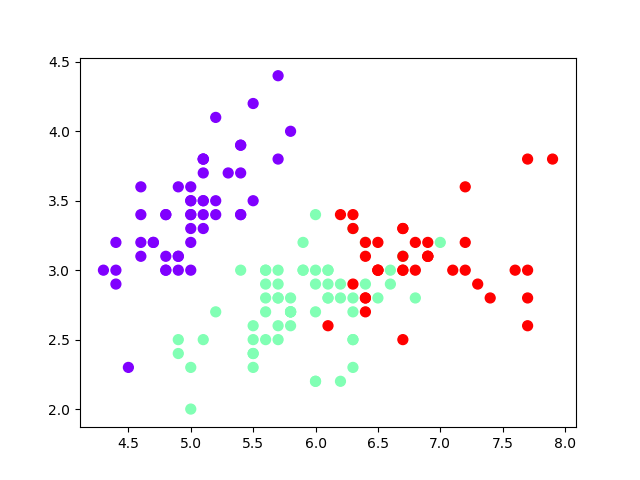
4). 鸢尾花完整数据做聚类并用散点图显示.
from sklearn.datasets import load_iris
import matplotlib.pyplot as plt
from sklearn.cluster import KMeans

iris=load_iris()
X=iris.data

est=KMeans(n_clusters=3)
est.fit(X)
kc=est.cluster_centers_
y_kmeans=est.predict(X)

print(y_kmeans,kc)
print(kc.shape,y_kmeans.shape,X.shape)
plt.scatter(X[:,0],X[:,1],c=y_kmeans,s=50,cmap='rainbow');
plt.show()
实验结果:
5).想想k均值算法中以用来做什么?
K-Means应用:
K均值算法在机器学习中属于简单易懂容易实现的算法之一,一般用于模式识别或者数据挖掘等等。