-
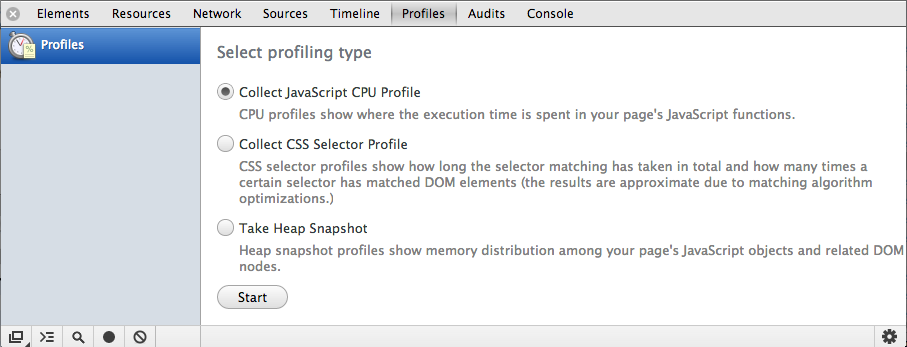
打开调试面板
-
操作会导致内从泄露的行为 Perform an action in your page that makes a leak
-
Take a new heap snaphot
-
Repeat steps 2 and 3 three times
-
Select the latest heap snapshot
-
Change the filter 'All Object' to 'Objects between Snapshot 1 and 2'
-
You should now see a set of leaked objects. You can select one and look at the list of retainers in the Object's retaining tree for insights into what is causing leaks.

More: BloatBusters - Eliminating Memory Leaks In GMail
Understanding Nodes In The Heap Profiler
Red nodes are those that are staying alive because they're part of a detached DOM tree and there is a node in the tree referenced from JavaScript (either as a closure variable or by some property).
Yellow nodes indicate a detached DOM node reference from an object's property or an array element - there should be a chain of properties leading from the DOM window to the element (e.g window.foo.bar[2].baz).

More: Understanding Nodes In The Heap Profiler | G+
Understanding time spent in CPU profiler
In the CPU profiler, "(idle)" time is now marked as such. Time spent in non-browser processing is "(program)".

Additional insights with Heap profiler views
One common question we get asked is 'what are the differences between the Comparison, Dominator, Containment and Summary views in DevTools > Profiles > Heap snapshot'. These views provide additional insights into the data exposed by the profiler and break down as follows:
Comparison view helps you track down memory leaks, by displaying which objects have been correctly cleaned up by the garbage collector. Generally used to record and compare two (or more) memory snapshots of before and after an operation. The idea is that inspecting the delta in freed memory and reference count lets you confirm the presence and cause of a memory leak.
Dominators view helps confirm that no unexpected references to objects are still hanging around (i.e that they are well contained) and that deletion/garbage collection is actually working.
Summary view helps you hunt down objects (and their memory use) based on type grouped by constructor name. This view is particularly helpful for tracking down DOM leaks.
Containment view provides a better view of object structure, helping us analyze objects referenced in the global namespace (i.e. window) to find out what is keeping them around. It lets you analyze closures and dive into your objects at a low level.

More: Taming The Unicorn: Easing JavaScript Memory Profiling In Chrome | AddyOsmani.com