- 准备Prometheus环境和Grafana (3.10)
- 手动或者cli 添加nuget包引用 prometheus-net.AspNetCore
- 定义自定义middleview (需要其他的属性可以自己扩展这里随便举例两个属性)
using Microsoft.AspNetCore.Builder;
using Microsoft.AspNetCore.Http;
using Microsoft.Extensions.Logging;
using Prometheus;
using System;
using System.Collections.Generic;
using System.Diagnostics;
using System.Linq;
using System.Threading.Tasks;

namespace PrometheusTest2
{
    public class RequestMiddleware
    {
        private readonly RequestDelegate _next;
        private readonly ILogger _logger;

        public RequestMiddleware(
            RequestDelegate next
            , ILoggerFactory loggerFactory
            )
        {
            this._next = next;
            this._logger = loggerFactory.CreateLogger<RequestMiddleware>();
        }
        // Name of the Response Header, Custom Headers starts with "X-"
        //private const string RESPONSE_HEADER_RESPONSE_TIME = "X-Response-Time-ms";
        public async Task Invoke(HttpContext httpContext)
        {
            var path = httpContext.Request.Path.Value;
            var method = httpContext.Request.Method;
           //定义接口请求次数 只增不减
            var counter = Metrics.CreateCounter("prometheus_demo_request_total", "HTTP Requests Total", new CounterConfiguration
            {
                LabelNames = new[] { "path", "method", "status" }
            });

            //只统计成功的时间 (随着请求变化)
            var gauge = Metrics.CreateGauge("http_response_time", "Http Response Time ", new GaugeConfiguration
            {
                LabelNames = new[] { "path", "method" }
            });

            var statusCode = 200;
            var watch = new Stopwatch();
            //var responseTime = "0";
            watch.Start();
            httpContext.Response.OnStarting(() =>
            {
                // Stop the timer information and calculate the time
                watch.Stop();
                //var responseTimeForCompleteRequest = watch.ElapsedMilliseconds;
                // Add the Response time information in the Response headers.
                //responseTime = responseTimeForCompleteRequest.ToString();
                if (path != "/metrics")
                {
                    statusCode = httpContext.Response.StatusCode;
                    counter.Labels(path, method, statusCode.ToString()).Inc();
                    gauge.Labels(path, method).Inc();
                    gauge.Set(watch.ElapsedMilliseconds);
                }
                return Task.CompletedTask;
            });
            try
            {
                await _next.Invoke(httpContext);
            }
            catch (Exception)
            {
                statusCode = 500;
                counter.Labels(path, method, statusCode.ToString()).Inc();

                throw;
            }

        }
    }

    public static class RequestMiddlewareExtensions
    {
        public static IApplicationBuilder UseRequestMiddleware(this IApplicationBuilder builder)
        {
            return builder.UseMiddleware<RequestMiddleware>();
        }
    }
}
- startup添加引用
   app.UseMetricServer();

   app.UseRequestMiddleware();
- 打开本地服务查看自定义监控属性

-
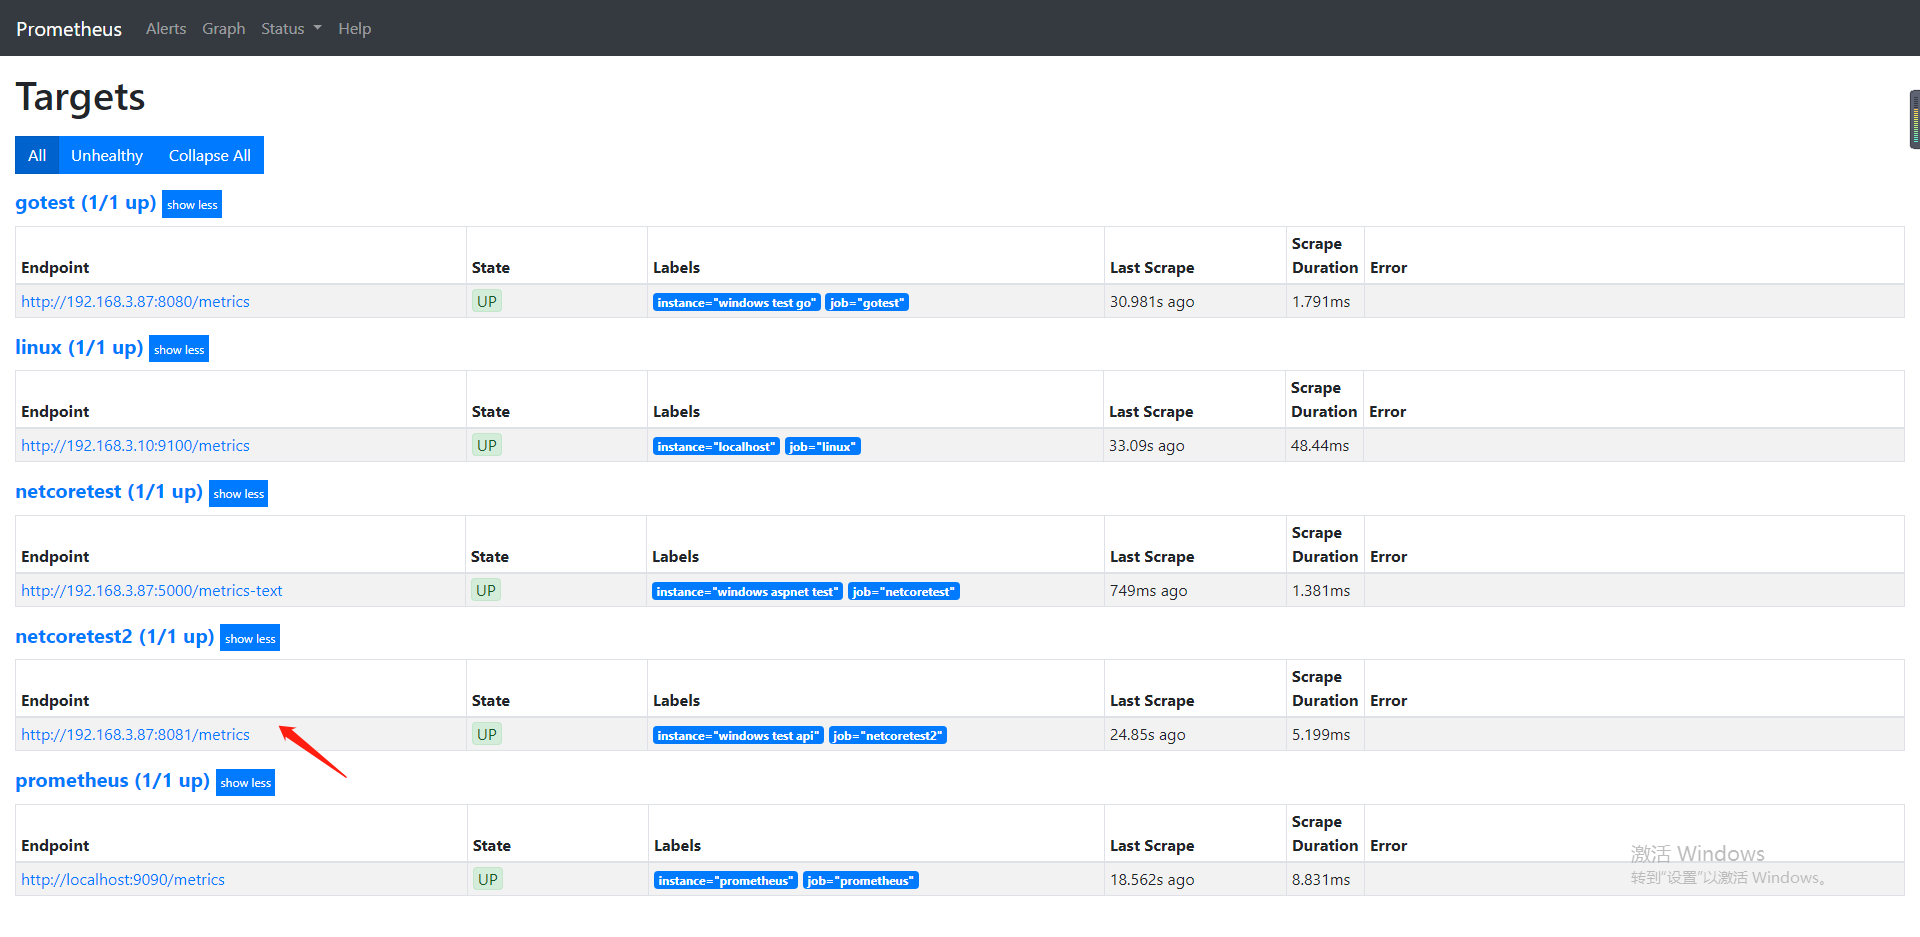
配置Prometheus yml

global:
  scrape_interval:     60s
  evaluation_interval: 60s

scrape_configs:
  - job_name: prometheus
    static_configs:
      - targets: ['localhost:9090']
        labels:
          instance: prometheus

  - job_name: linux
    static_configs:
      - targets: ['192.168.3.10:9100']
        labels:
          instance: localhost

  - job_name: gotest
    static_configs:
      - targets: ['192.168.3.87:8080']
        labels:
          instance: windows test go

  - job_name: netcoretest
    scrape_interval: 15s
    scrape_timeout: 10s
    metrics_path: /metrics-text
    static_configs:
      - targets: ['192.168.3.87:5000']
        labels:
          instance: windows aspnet  test

  - job_name: netcoretest2
    static_configs:
      - targets: ['192.168.3.87:8081']
        labels:
          instance: windows test api
- 为了快速查看数据重启Prometheus服务
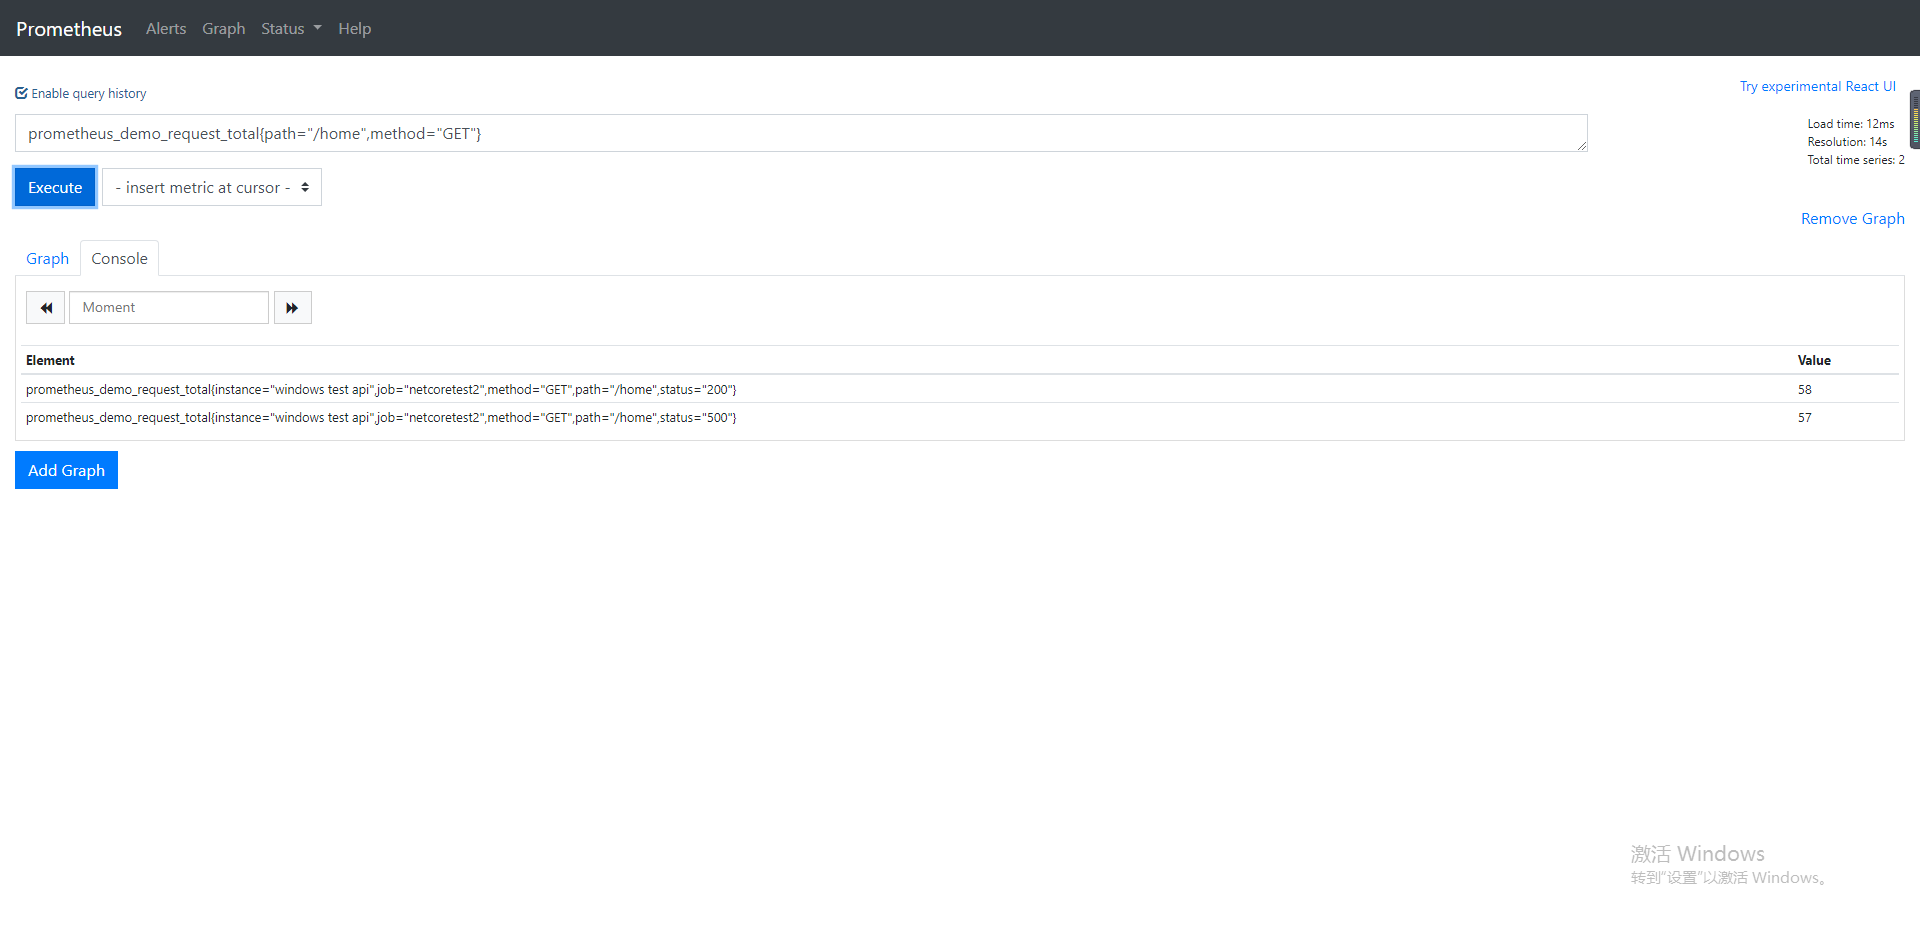
- 使用语句快速查询自定义属性
- 在Grafana 配置仪表盘展示自定义属性
- 首先配置数据源DataSource 参考https://www.cnblogs.com/chongyao/p/13993046.html
- 添加dashboard
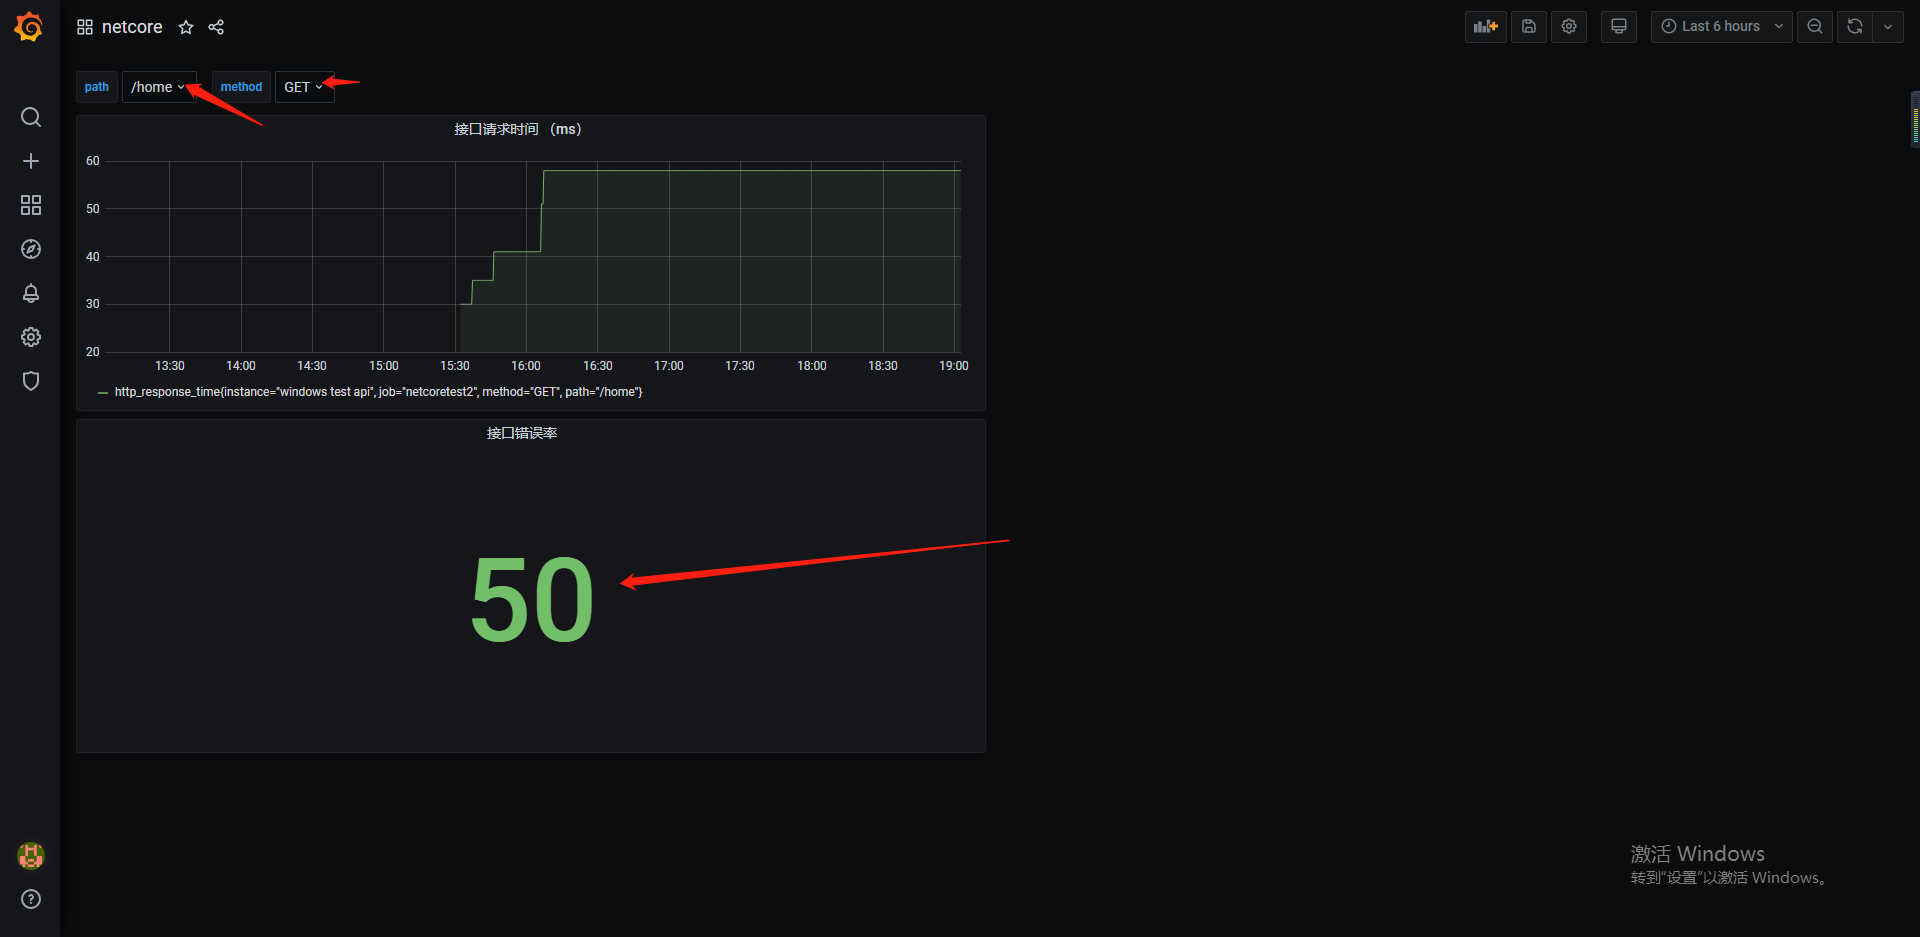
- 添加全局搜索条件 (这里监听的接口太多新增字段搜索)

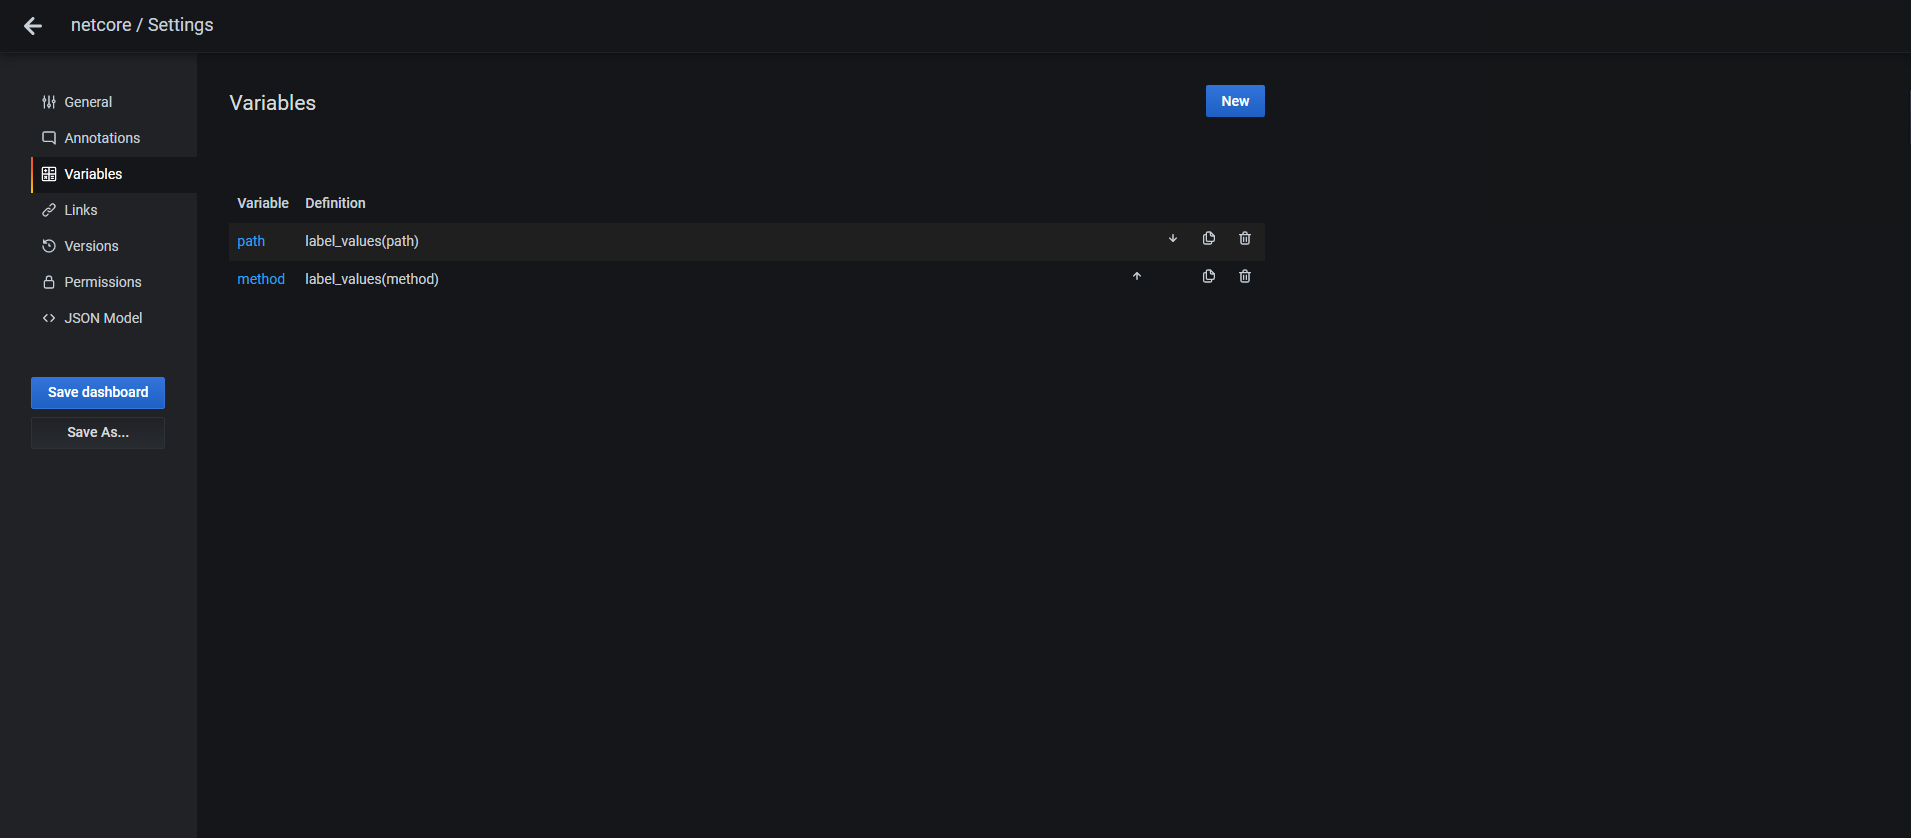
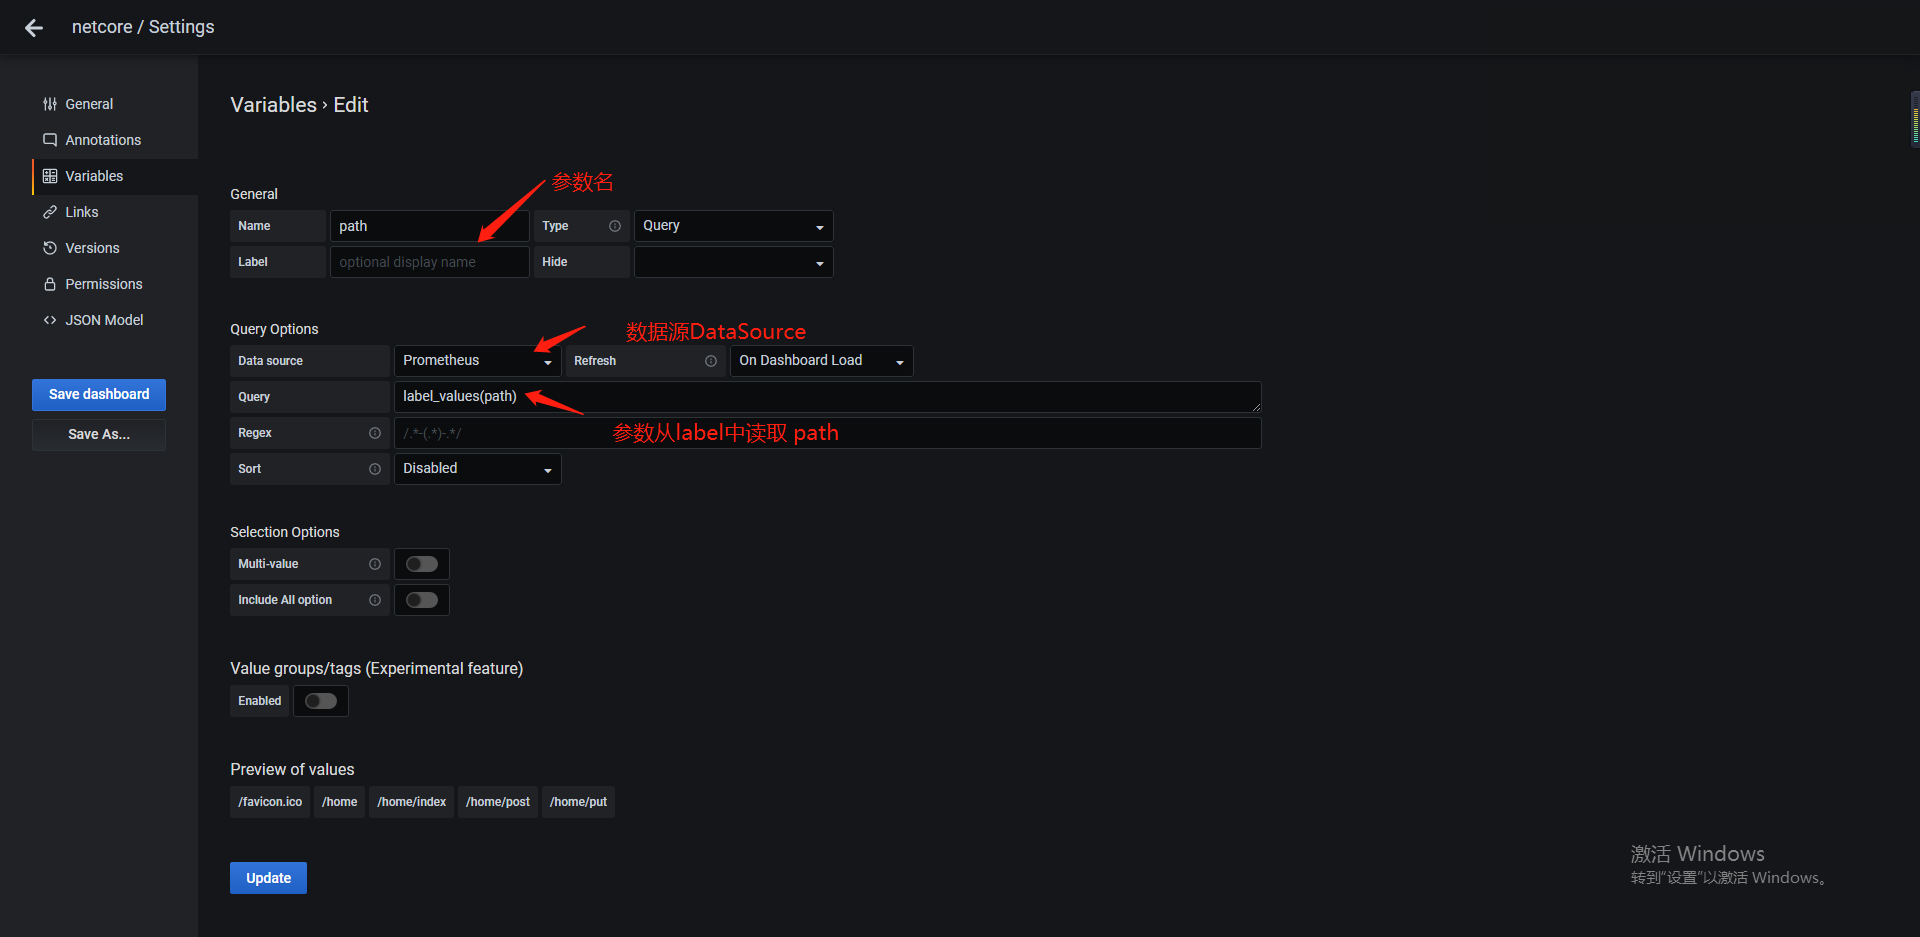
成功后如下图所示:

- 添加 panel (我这里要算出接口的错误率 status=500/总请求数)

点击Transform 算出结果集
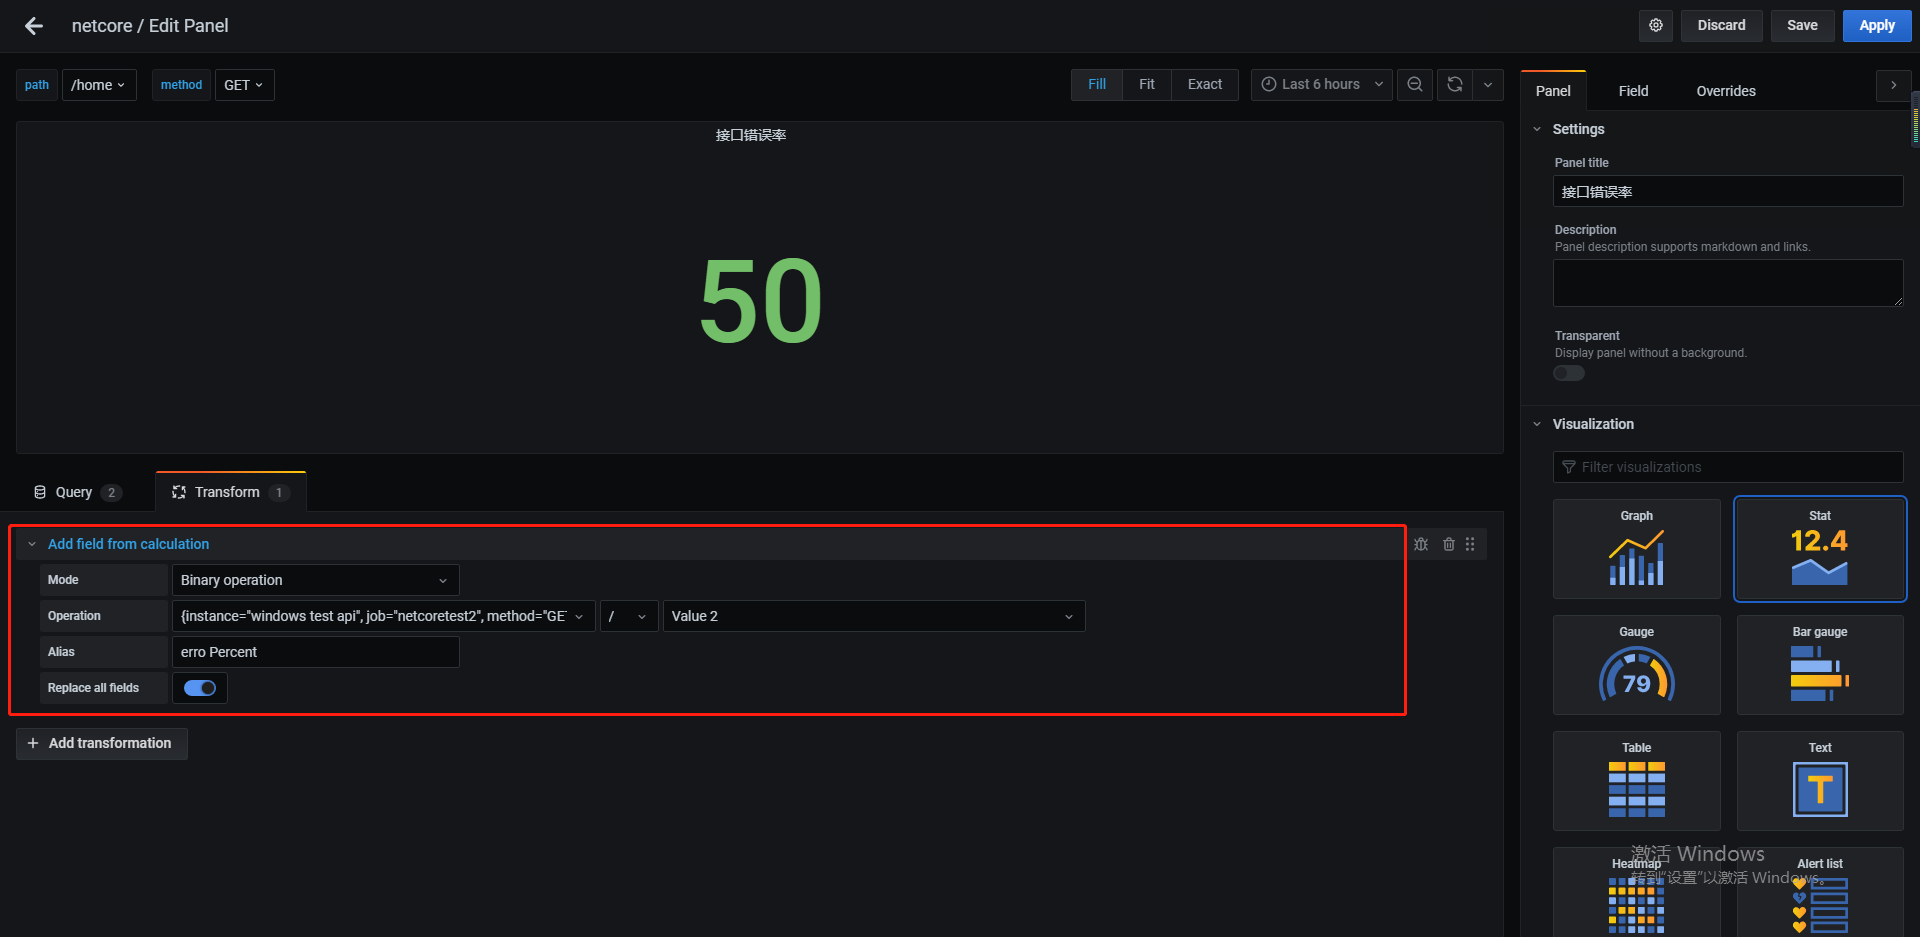
-
添加耗时面板
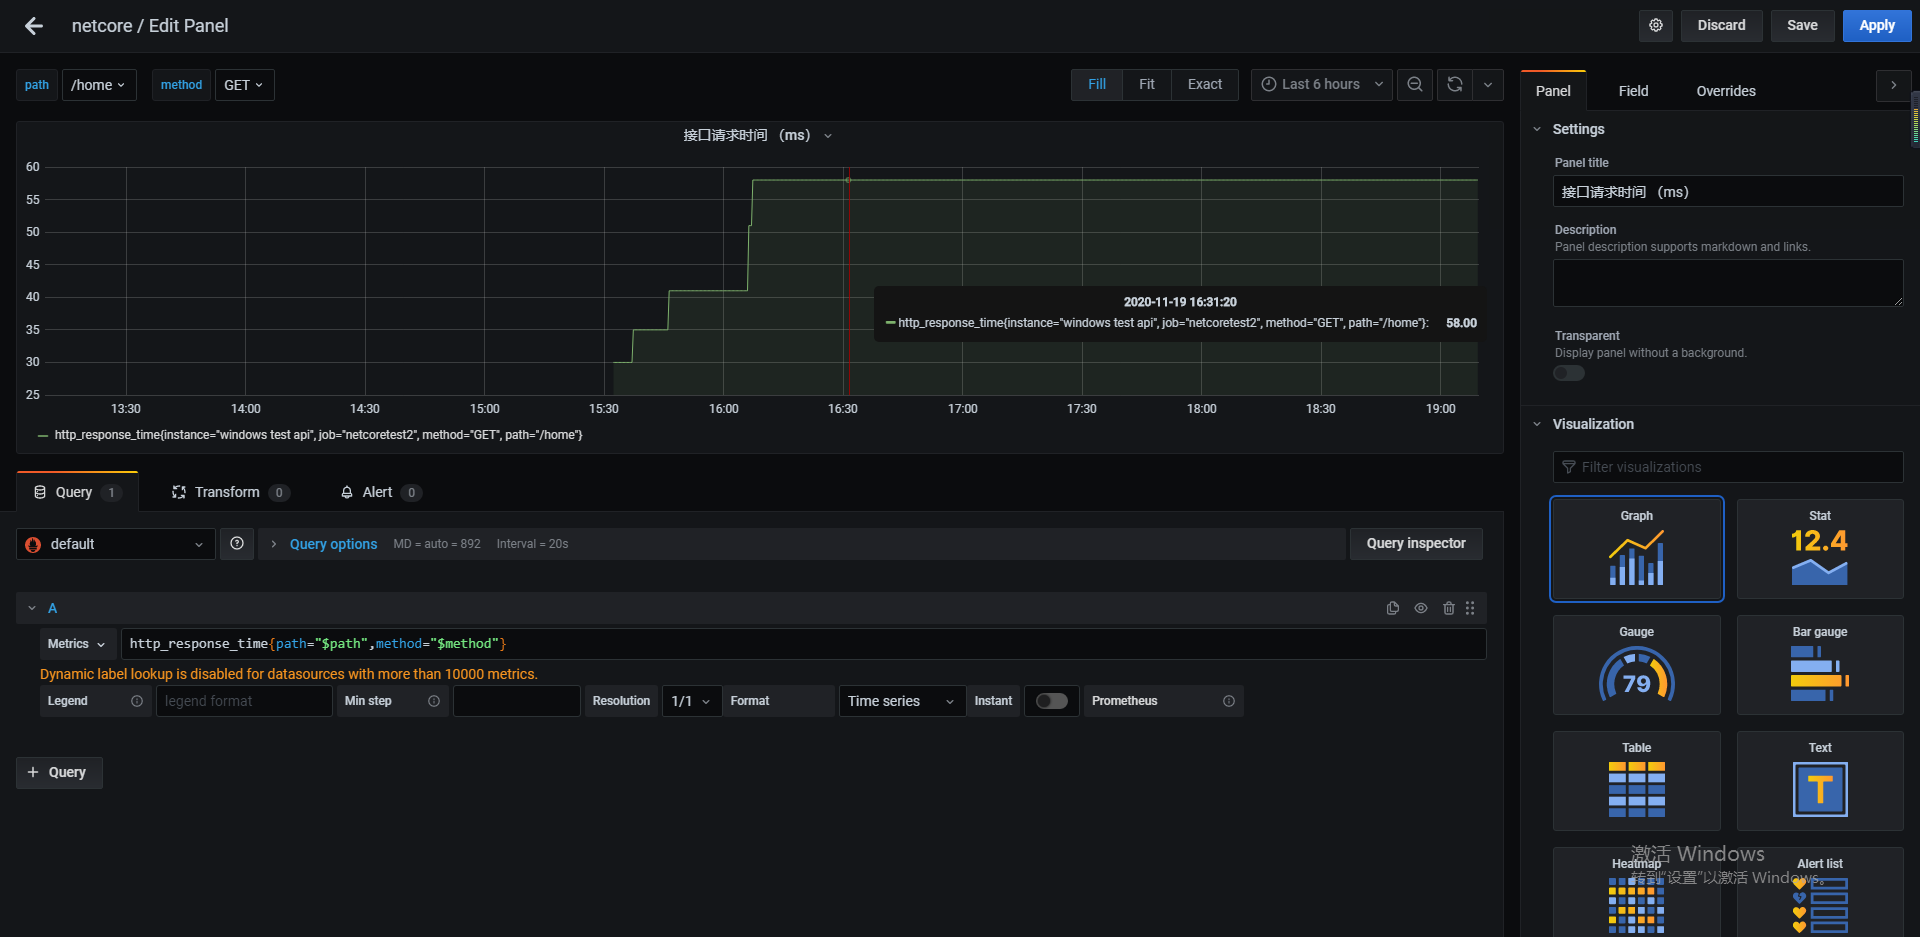
- 最终效果