MySQL基准测试和sysbench工具

参考https://www.cnblogs.com/kismetv/archive/2017/09/30/7615738.html

一、基准测试的作用

sysbench是一个开源的、模块化的、跨平台的多线程性能测试工具,可以用来进行CPU、内存、磁盘I/O、线程、数据库的性能测试。目前支持的数据库有MySQL、Oracle和PostgreSQL。以下操作都将以支持MySQL数据库为例进行。 
Sysbench的测试主要包括以下几个方面: 
1、磁盘io性能 
2、cpu性能 
3、内存分配及传输速度 
4、POSIX线程性能 
5、调度程序性能 
6、数据库性能(OLTP基准测试).

二、基准测试的指标

常见的数据库指标包括:

  • TPS/QPS:衡量吞吐量。
  • 响应时间:包括平均响应时间、最小响应时间、最大响应时间、时间百分比等,其中时间百分比参考意义较大,如前95%的请求的最大响应时间。。
  • 并发量:同时处理的查询请求的数量。

三、基准测试的分类

对MySQL的基准测试,有如下两种思路:

(1)针对整个系统的基准测试:通过http请求进行测试,如通过浏览器、APP或postman等测试工具。该方案的优点是能够更好的针对整个系统,测试结果更加准确;缺点是设计复杂实现困难。

(2)只针对MySQL的基准测试:优点和缺点与针对整个系统的测试恰好相反。

在针对MySQL进行基准测试时,一般使用专门的工具进行,例如mysqlslap、sysbench等。其中,sysbench比mysqlslap更通用、更强大,且更适合Innodb(因为模拟了许多Innodb的IO特性),下面介绍使用sysbench进行基准测试的方法。

四、安装

https://github.com/akopytov/sysbench官网

#git clone https://github.com/akopytov/sysbench.git

#autogen.sh 运行生成configure

#./configure --prefix=/root/sysbench --with-mysql-includes=/usr/local/mysql/include/ --with-mysql-libs=/usr/local/mysql/lib/

#make && make install


默认支持MySQL,如果需要测试Oracle/PostgreSQL,则在configure时需要加上–with-oracle或者–with-pgsql参数.

依赖库安装 
需要安装m4 autoconf automake libtool 这几个包,通过 
yum install m4 autoconf automake libtool可进行安装,否则会报错( xxx… wasn’t found, exiting) 
./autogen.sh (如果是源码编译安装就不需要执行了) 
执行后在目录下会出现configure文件夹,就说明可以开始执行配置了。

./configure --prefix=/root/sysbench --with-mysql-includes=/usr/local/mysql/include/ --with-mysql-libs=/usr/local/mysql/lib/

需要指定include和lib目录。如果没有,说明安装时候没有安装安装开发包,这个要单独安装的,找Development Libraries 包. 
安装完成后执行:

[root@localhost sysbench]# ll -rth sysbench
total 236K
-rw-r--r--. 1 root root 7.1K Jun 18 04:12 sysbench.h
[root@localhost sysbench]# make
Making all in doc
make[1]: Entering directory `/root/sysbench/doc'
......
[root@localhost sysbench]# make install
Making install in doc
make[1]: Entering directory `/root/sysbench/doc'
.....

没有报错的话就在当前的/root/sysbench/sysbench目录下会生成一个二进制可执行文件:sysbench

[root@localhost sysbench]# ll
total 4096
-rw-r--r--. 1 root root    3661 Jun 18 04:12 CMakeLists.txt
-rw-r--r--. 1 root root   24391 Jun 18 04:12 db_driver.c
-rw-r--r--. 1 root root    9911 Jun 18 04:12 db_driver.h
-rw-r--r--. 1 root root  129832 Jun 18 08:49 db_driver.o
drwxr-xr-x. 7 root root    4096 Jun 18 12:50 drivers
-rw-r--r--. 1 root root   25253 Jun 18 12:50 Makefile
-rw-r--r--. 1 root root    2020 Jun 18 04:12 Makefile.am
-rw-r--r--. 1 root root   25998 Jun 18 06:12 Makefile.in
-rw-r--r--. 1 root root    3640 Jun 18 04:12 sb_list.h
-rw-r--r--. 1 root root   16223 Jun 18 04:12 sb_logger.c
-rw-r--r--. 1 root root    4554 Jun 18 04:12 sb_logger.h
-rw-r--r--. 1 root root  116256 Jun 18 08:49 sb_logger.o
-rw-r--r--. 1 root root   13731 Jun 18 04:12 sb_options.c
-rw-r--r--. 1 root root    3108 Jun 18 04:12 sb_options.h
-rw-r--r--. 1 root root  109536 Jun 18 08:49 sb_options.o
-rw-r--r--. 1 root root    3456 Jun 18 04:12 sb_percentile.c
-rw-r--r--. 1 root root    1570 Jun 18 04:12 sb_percentile.h
-rw-r--r--. 1 root root   64616 Jun 18 08:49 sb_percentile.o
-rw-r--r--. 1 root root    5982 Jun 18 04:12 sb_timer.c
-rw-r--r--. 1 root root    3796 Jun 18 04:12 sb_timer.h
-rw-r--r--. 1 root root   54544 Jun 18 08:49 sb_timer.o
-rw-r--r--. 1 root root    6860 Jun 18 04:12 sb_win.c
-rw-r--r--. 1 root root    2747 Jun 18 04:12 sb_win.h
drwxr-xr-x. 4 root root    4096 Jun 18 12:50 scripting
-rwxr-xr-x. 1 root root 3300573 Jun 18 12:24 sysbench
[root@localhost sysbench]# ./sysbench --help
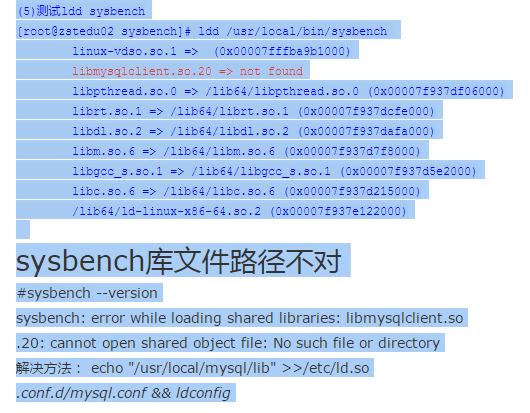
./sysbench: error while loading shared libraries: libmysqlclient.so.18: cannot open shared object file: No such file or directory
[root@localhost sysbench]# ldd sysbench
    linux-vdso.so.1 =>  (0x00007fff3dd70000)
    libmysqlclient.so.18 => not found   //重点在这里,链接库没找到,只好手动加一下
    libdl.so.2 => /lib64/libdl.so.2 (0x00007f95b0e55000)
    librt.so.1 => /lib64/librt.so.1 (0x00007f95b0c4d000)
    libm.so.6 => /lib64/libm.so.6 (0x00007f95b09c9000)
    libpthread.so.0 => /lib64/libpthread.so.0 (0x00007f95b07ab000)
    libc.so.6 => /lib64/libc.so.6 (0x00007f95b0417000)
    /lib64/ld-linux-x86-64.so.2 (0x00007f95b1068000)
[root@localhost sysbench]# ln -s /usr/local/mysql/lib/libmysqlclient.so.18 /usr/lib   //手动建立一个软链接
[root@localhost sysbench]# ldconfig  //生效
[root@localhost sysbench]# ldd sysbench //在查看就找到ibmysqlclient.so.18
    linux-vdso.so.1 =>  (0x00007fffc5ffc000)
    libmysqlclient.so.18 => /usr/lib/libmysqlclient.so.18 (0x00007fa7895d8000)
    libdl.so.2 => /lib64/libdl.so.2 (0x00007fa7893d4000)
    librt.so.1 => /lib64/librt.so.1 (0x00007fa7891cb000)
    libm.so.6 => /lib64/libm.so.6 (0x00007fa788f47000)
    libpthread.so.0 => /lib64/libpthread.so.0 (0x00007fa788d2a000)
    libc.so.6 => /lib64/libc.so.6 (0x00007fa788995000)
    libstdc++.so.6 => /usr/lib64/libstdc++.so.6 (0x00007fa78868f000)
    libgcc_s.so.1 => /lib64/libgcc_s.so.1 (0x00007fa788479000)
    /lib64/ld-linux-x86-64.so.2 (0x00007fa789bb0000)
[root@localhost sysbench]# ./sysbench --help //执行help成功
[root@localhost ~]# sysbench --help
Missing required command argument.
Usage:
  sysbench [general-options]... --test=<test-name> [test-options]... command

General options:
  --num-threads=N             使用线程数 默认[1]
  --max-requests=N            limit for total number of requests [10000]
  --max-time=N                limit for total execution time in seconds [0]
  --forced-shutdown=STRING    amount of time to wait after --max-time before forcing shutdown [off]
  --thread-stack-size=SIZE    size of stack per thread [64K]
  --tx-rate=N                 target transaction rate (tps) [0]
  --report-interval=N         periodically report intermediate statistics with a specified interval in seconds. 0 disables intermediate reports [0]
  --report-checkpoints=[LIST,...]dump full statistics and reset all counters at specified points in time. The argument is a list of comma-separated values representing the amount of time in seconds elapsed from start of test when report checkpoint(s) must be performed. Report checkpoints are off by default. []
  --test=STRING               test to run
  --debug=[on|off]            print more debugging info [off]
  --validate=[on|off]         perform validation checks where possible [off]
  --help=[on|off]             print help and exit
  --version=[on|off]          print version and exit [off]
  --rand-init=[on|off]        initialize random number generator [off]
  --rand-type=STRING          random numbers distribution {uniform,gaussian,special,pareto} [special]
  --rand-spec-iter=N          number of iterations used for numbers generation [12]
  --rand-spec-pct=N           percentage of values to be treated as 'special' (for special distribution) [1]
  --rand-spec-res=N           percentage of 'special' values to use (for special distribution) [75]
  --rand-seed=N               seed for random number generator, ignored when 0 [0]
  --rand-pareto-h=N           parameter h for pareto distibution [0.2]

Log options:
  --verbosity=N      verbosity level {5 - debug, 0 - only critical messages} [3]

  --percentile=N      percentile rank of query response times to count [95]

Compiled-in tests:
  fileio - File I/O test
  cpu - CPU performance test
  memory - Memory functions speed test
  threads - Threads subsystem performance test
  mutex - Mutex performance test

Commands: prepare run cleanup help version

See 'sysbench --test=<name> help' for a list of options for each test.
  • 测试fileio命令帮助:
[root@db-master ~]# sysbench --test=fileio help  
sysbench 0.4.12:  multi-threaded system evaluation benchmark
fileio options: 
参数详解:
--file-num=N          代表生成测试文件的数量,默认为128。
--file-block-size=N      测试时所使用文件块的大小,如果想磁盘针对innodb存储引擎进行测试,可以将其设置为16384,即innodb存储引擎页的大小。默认为16384。
--file-total-size=SIZE     创建测试文件的总大小,默认为2G大小。
--file-test-mode=STRING 文件测试模式,包含:seqwr(顺序写), seqrewr(顺序读写), seqrd(顺序读), rndrd(随机读), rndwr(随机写), rndrw(随机读写)。
--file-io-mode=STRING   文件操作的模式,sync(同步),async(异步),fastmmap(快速mmap),slowmmap(慢速mmap),默认为sync同步模式。
--file-async-backlog=N   对应每个线程队列的异步操作数,默认为128。
--file-extra-flags=STRING 打开文件时的选项,这是与API相关的参数。
--file-fsync-freq=N      执行fsync()函数的频率。fsync主要是同步磁盘文件,因为可能有系统和磁盘缓冲的关系。 0代表不使用fsync函数。默认值为100。
--file-fsync-all=[on|off]  每执行完一次写操作,就执行一次fsync。默认为off。
--file-fsync-end=[on|off] 在测试结束时执行fsync函数。默认为on。
--file-fsync-mode=STRING文件同步函数的选择,同样是和API相关的参数,由于多个操作系统对于fdatasync支持不同,因此不建议使用fdatasync。默认为fsync。
--file-merged-requests=N 大多情况下,合并可能的IO的请求数,默认为0。
--file-rw-ratio=N         测试时的读写比例,默认时为1.5,即可3:2。

测试cpu命令帮助:

[root@db-master ~]# sysbench --test=cpu help
sysbench 0.4.12:  multi-threaded system evaluation benchmark
cpu options:
 参数详解:
  --cpu-max-prime=N      用来选项指定最大的素数,具体参数可以根据CPU的性能来设置,默认为10000

测试memory命令帮助:

[root@db-master ~]# sysbench  --test=memory help
sysbench 0.4.12:  multi-threaded system evaluation benchmark
memory options:
参数详解:
  --memory-block-size=SIZE      测试内存块的大小,默认为1K
  --memory-total-size=SIZE       数据传输的总大小,默认为100G
  --memory-scope=STRING       内存访问的范围,包括全局和本地范围,默认为global
  --memory-hugetlb=[on|off]     是否从HugeTLB池分配内存的开关,默认为off
  --memory-oper=STRING        内存操作的类型,包括read, write, none,默认为write
  --memory-access-mode=STRING 内存访问模式,包括seq,rnd两种模式,默认为seq

测试threads命令帮助:

[root@db-master ~]# sysbench  --test=threads help
sysbench 0.4.12:  multi-threaded system evaluation benchmark
threads options:
参数详解: 
  --thread-yields=N      指定每个请求的压力,默认为1000
  --thread-locks=N       指定每个线程的锁数量,默认为8

测试mutex命令帮助:

[root@db-master ~]# sysbench  --test=mutex help 
sysbench 0.4.12:  multi-threaded system evaluation benchmark
mutex options:
参数详解:
  --mutex-num=N    数组互斥的总大小。默认是4096
  --mutex-locks=N    每个线程互斥锁的数量。默认是50000
  --mutex-loops=N    内部互斥锁的空循环数量。默认是10000

测试oltp命令帮助:

[root@db-master ~]# sysbench --test=oltp help 
sysbench 0.4.12:  multi-threaded system evaluation benchmark
oltp options:
参数详解:
  --oltp-test-mode=STRING    执行模式{simple,complex(advanced transactional),nontrx(non-transactional),sp}。默认是complex
  --oltp-reconnect-mode=STRING 重新连接模式{session(不使用重新连接。每个线程断开只在测试结束),transaction(在每次事务结束后重新连接),query(在每个SQL语句执行完重新连接),random(对于每个事务随机选择以上重新连接模式)}。默认是session
  --oltp-sp-name=STRING   存储过程的名称。默认为空
  --oltp-read-only=[on|off]  只读模式。Update,delete,insert语句不可执行。默认是off
  --oltp-skip-trx=[on|off]   省略begin/commit语句。默认是off
  --oltp-range-size=N      范围查询的范围大小,该值应比oltp-table-size小。默认是100
  --oltp-point-selects=N          单个事务中指定的selec查询个数 [10]
  --oltp-simple-ranges=N          单个事务中指定的简单范围查询个数 [1]
  --oltp-sum-ranges=N             单个事务中指定的SUM范围查询个数 [1]
  --oltp-order-ranges=N           单个事务中指定的ORDER范围查询个数 [1]
  --oltp-distinct-ranges=N         单个事务中指定的DISTINCT范围查询个数 [1]
  --oltp-index-updates=N          单个事务中指定的使用索引更新的个数 [1]
  --oltp-non-index-updates=N     单个事务中指定的不使用索引更新的个数 [1]
  --oltp-nontrx-mode=STRING   查询类型对于非事务执行模式{select, update_key, update_nokey, insert, delete} [select]
  --oltp-auto-inc=[on|off]      AUTO_INCREMENT是否开启。默认是on
  --oltp-connect-delay=N     在多少微秒后连接数据库。默认是10000
  --oltp-user-delay-min=N    每个请求最短等待时间。单位是ms。默认是0
  --oltp-user-delay-max=N    每个请求最长等待时间。单位是ms。默认是0
  --oltp-table-name=STRING  测试时使用到的表名。默认是sbtest
  --oltp-table-size=N         测试表的记录数。默认是10000
  --oltp-dist-type=STRING    分布的随机数{uniform(均匀分布),Gaussian(高斯分布),special(空间分布)}。默认是special
  --oltp-dist-iter=N    产生数的迭代次数。默认是12
  --oltp-dist-pct=N    特殊分布的百分比值 (for special distribution)。 默认是1
  --oltp-dist-res=N    ‘special’的百分比值。默认是75
General database options:
  --db-driver=STRING  specifies database driver to use ('help' to get list of available drivers)
  --db-ps-mode=STRING prepared statements usage mode {auto, disable} [auto]
Compiled-in database drivers:
  mysql - MySQL driver
  pgsql - PostgreSQL driver
mysql options:
  --mysql-host=[LIST,...]       MySQL server 地址 默认[localhost]
  --mysql-port=N                MySQL server 端口 默认[3306]
  --mysql-socket=STRING         MySQL socket
  --mysql-user=STRING           MySQL 用户名 默认[sbtest]
  --mysql-password=STRING       MySQL 密码 默认[]
  --mysql-db=STRING             MySQL database name [sbtest]
  --mysql-table-engine=STRING   使用的存储引擎包括{myisam,innodb,bdb,heap,ndbcluster,federated} 默认[innodb]
  --mysql-engine-trx=STRING     whether storage engine used is transactional or not {yes,no,auto} [auto]
  --mysql-ssl=[on|off]          use SSL connections, if available in the client library [off]
  --myisam-max-rows=N           max-rows parameter for MyISAM tables [1000000]
  --mysql-create-options=STRING additional options passed to CREATE TABLE []
pgsql options:
  --pgsql-host=STRING     PostgreSQL server host [localhost]
  --pgsql-port=N          PostgreSQL server port [5432]
  --pgsql-user=STRING     PostgreSQL user [sbtest]
  --pgsql-password=STRING PostgreSQL password []
  --pgsql-db=STRING       PostgreSQL database name [sbtest]
  • 总结: 

以上就是sysbench工具的安装配置及相关选项参数的介绍,可以根据自己的需要添加对应的参数进行压力测试即可。在下一篇文档中将会对上面的几种模式进行相应的测试。

不用在目录执行sysbench

[root@localhost sysbench]# cp /root/sysbench/sysbench/sysbench /usr/local/bin/
[root@localhost sysbench]# cd /root
[root@localhost ~]# sysbench --help
  • 1
  • 2
  • 3

CPU测试:

sysbench CPU测试使用64位整数,测试计算素数直到某个最大值(cpu-max-prime)所需要的时间, 
查看CPU信息方法 
查看物理cpu个数 
grep "physical id" /proc/cpuinfo | sort -u | wc -l 
查看核心数量 
grep "core id" /proc/cpuinfo | sort -u | wc -l 
查看线程数量 
grep "processor" /proc/cpuinfo | sort -u | wc -l

在sysbench的测试中,–num-threads取值为”线程数量”即可

[root@localhost ~]# sysbench --test=cpu --cpu-max-prime=10000 --num-threads=2 run
sysbench 0.5:  multi-threaded system evaluation benchmark

Running the test with following options:
Number of threads: 2
Random number generator seed is 0 and will be ignored


Primer numbers limit: 10000

Threads started!


General statistics:
    total time:                          6.0122s
    total number of events:              10000
    total time taken by event execution: 12.0109s
    response time:
         min:                                  1.04ms
         avg:                                  1.20ms
         max:                                  7.87ms
         approx.  95 percentile:               1.43ms

Threads fairness:
    events (avg/stddev):           5000.0000/9.00
    execution time (avg/stddev):   6.0055/0.00

线程(thread)测试

测试线程调度器的性能。对于高负载情况下测试线程调度器的行为非常有用

[root@localhost ~]# sysbench --test=threads --num-threads=2 --thread-yields=100 --thread-locks=2 run
sysbench 0.5:  multi-threaded system evaluation benchmark

Running the test with following options:
Number of threads: 2
Random number generator seed is 0 and will be ignored


Threads started!


General statistics:
    total time:                          0.4479s
    total number of events:              10000
    total time taken by event execution: 0.8868s
    response time:
         min:                                  0.02ms
         avg:                                  0.09ms
         max:                                  3.87ms
         approx.  95 percentile:               0.14ms

Threads fairness:
    events (avg/stddev):           5000.0000/1.00
    execution time (avg/stddev):   0.4434/0.00

文件IO性能测试

生成需要的测试文件,文件总大小5G,16个并发线程。执行完后会在当前目录下生成一堆小文件。 
在测试之前先看下磁盘空间

[root@localhost ~]# df -hl
Filesystem            Size  Used Avail Use% Mounted on
/dev/sda1              52G   11G   41G  21% /
tmpfs                 497M     0  497M   0% /dev/shm
[root@localhost ~]# sysbench --test=fileio --file-total-size=2g --file-test-mode=rndrw --num-threads=2 --init-rng=on --file-num=16 --file-block-size=16384 run
sysbench 0.5:  multi-threaded system evaluation benchmark

Running the test with following options:
Number of threads: 2
Random number generator seed is 0 and will be ignored


Extra file open flags: 0
16 files, 128Mb each
2Gb total file size
Block size 16Kb
Number of IO requests: 10000
Read/Write ratio for combined random IO test: 1.50
Periodic FSYNC enabled, calling fsync() each 100 requests.
Calling fsync() at the end of test, Enabled.
Using synchronous I/O mode
Doing random r/w test
Threads started!

Operations performed:  5999 reads, 4001 writes, 1600 Other = 11600 Total
Read(每秒随机读) 93.734Mb  Written(随机写) 62.516Mb  Total transferred 156.25Mb  (27.144Mb/sec) 吞吐量
 1737.20 Requests/sec executed

General statistics:
    total time:                          5.7564s
    total number of events:              10000
    total time taken by event execution: 5.0908s
    response time:
         min:                                  0.00ms
         avg:                                  0.51ms
         max:                                159.40ms
         approx.  95 percentile:               0.13ms

Threads fairness:
    events (avg/stddev):           5000.0000/306.00
    execution time (avg/stddev):   2.5454/0.50

测试完成执行cleanup
测试结束后,记得执行cleanup,以确保测试所产生的文件都已删除:
[root@localhost ~]# sysbench --test=fileio --file-num=16 --file-total-size=2g cleanup
sysbench 0.5:  multi-threaded system evaluation benchmark

Removing test files...

互斥锁(Mutex)测试

测试互斥锁的性能,方式是模拟所有线程在同一时刻并发运行,并都短暂请求互斥锁。

[root@localhost ~]# sysbench --test=mutex --num-threads=2 --mutex-num=1024 --mutex-locks=10000 --mutex-loops=5000 run
sysbench 0.5:  multi-threaded system evaluation benchmark

Running the test with following options:
Number of threads: 2
Random number generator seed is 0 and will be ignored


Threads started!


General statistics:
    total time:                          0.0013s
    total number of events:              2
    total time taken by event execution: 0.0010s
    response time:
         min:                                  0.46ms
         avg:                                  0.52ms
         max:                                  0.59ms
         approx.  95 percentile:               0.58ms

Threads fairness:
    events (avg/stddev):           1.0000/0.00
    execution time (avg/stddev):   0.0005/0.00

内存测试

内存测试测试了内存的连续读写性能。

[root@localhost ~]# sysbench --test=memory --num-threads=2 --memory-block-size=8192 --memory-total-size=1g run
sysbench 0.5:  multi-threaded system evaluation benchmark

Running the test with following options:
Number of threads: 2
Random number generator seed is 0 and will be ignored


Threads started!

Operations performed: 131072 (1264058.81 ops/sec)

1024.00 MB transferred (9875.46 MB/sec) 吞吐量


General statistics:
    total time:                          0.1037s
    total number of events:              131072
    total time taken by event execution: 0.1677s
    response time:
         min:                                  0.00ms
         avg:                                  0.00ms
         max:                                  4.30ms
         approx.  95 percentile:               0.00ms   95%的时间分布

Threads fairness:
    events (avg/stddev):           65536.0000/509.00
    execution time (avg/stddev):   0.0839/0.00

对mysql事务型OLTP的测试

sysbench 0.5通过一系列LUA脚本来替换之前的oltp,来模拟更接近真实的基准测试环境。这些测试脚本包含:insert.lua、oltp.lua、parallel_prepare.lua、select_random_points.lua、update_index.lua、delete.lua oltp_simple.lua、select.lua、select_random_ranges.lua、update_non_index.lua,脚本使用方式基本类似。 
sysbench 0.5默认使用sbtest库,但是需要自己手工先创建好,也可以使用–mysql-db指定,其他非默认项指定选项:

-mysql-host
-mysql-port
-mysql-socket
-mysql-user
-mysql-password
-mysql-db
-mysql-ssl

prepare 
生成表并插入数据,可使用parallel_prepare.lua脚本来并行准备数据。

–db-driver 服务器类型 mysql | drizzle,默认为mysql
–mysql-table-engine 表存数引擎
–myisam-max-rows MyISAM表MAX_ROWS选项(用于大表)
–oltp-table-count 生成表数量[sbtest1、sbtest2...]
–oltp-table-size 生成表的行数
–oltp-secondary ID列生成二级索引而不是主键
–oltp-auto-inc 设置ID列是否自增 on | off,默认为on

1 prepare准备阶段

首先要做的就是数据准备 
对于mysql的OLTP测试,和file一样,同样需要经历prepare,run,cleanup三个阶段。prepare阶段会在数据库中产生一张指定行数的表,默认表在sbtest架构下,表名为 
sbtest(sysbench默认生成表的存储引擎为innodb),如创建一张100万条记录的表: 
create database sbtest; 
然后

[root@localhost ~]# cd /root/sysbench/sysbench/
./sysbench --test=tests/db/parallel_prepare.lua --max-time=100 --oltp-dist-type=uniform --max-requests=0 --mysql-user=root --mysql-password="" --mysql-table-engine=innodb --oltp-table-size=100 --oltp-tables-count=8 --oltp-range-size=90 --oltp-point-selects=1 --oltp-simple-ranges=1 --oltp-sum-ranges=1 --oltp-order-ranges=1 --oltp-distinct-ranges=1 --oltp-non-index-updates=10 --num-threads=20  --mysql-host=127.0.0.1 --mysql-port=3306 prepare

测试:

./sysbench --test=tests/db/oltp.lua --max-time=100 --oltp-dist-type=uniform --max-requests=0 --mysql-user=root --mysql-password="" --mysql-table-engine=innodb
--oltp-table-size=100 --oltp-tables-count=8 --oltp-range-size=90 --oltp-point-selects=1 --oltp-simple-ranges=1 --oltp-sum-ranges=1 --oltp-order-ranges=1 --oltp-distinct-ranges=1 --oltp-non-index-updates=10 --num-threads=20  --mysql-host=127.0.0.1 --mysql-port=3306 run

参数说明: 
–test 指定使用的测试脚本 
–max-time=100 指定测试时长为100s 
–mysql-user 数据库帐号 
–mysql-password 数据库密码 
–mysql-table-engine 存储引擎类型 
–test 测试的类型oltp系统 
–num-threads 测试的线程数 
–mysql-host 数据库地址 
–mysql-port 数据库端口

测试结果:

Threads started!

OLTP test statistics:
    queries performed:
        read:                            179470-- 读总数
        write:                           453935-- 写总数
        other:                           70678-- 其他操作总数(SELECT、INSERT、UPDATE、DELETE之外的操作,例如COMMIT等)
        total:                           704083 -- 全部总数
    transactions事务量:                        34784  (347.32 per sec.)-- 总事务数(每秒事务数)
    read/write requests读写总操作:                 633405 (6324.57 per sec.) -- 读写总数(每秒读写次数)
    other operations其他操作:                    70678  (705.72 per sec.)-- 其他操作总数(每秒其他操作次数)
    ignored errors:                      1110   (11.08 per sec.)-- 每秒忽略的错误
    reconnects:                          0      (0.00 per sec.)--每秒重连次数

General statistics:
    total time(总时长):                          100.1499s -- 总耗时
    total number of events:              34784 -- 共发生多少事务数
    total time taken by event execution: 1996.2507s -- 所有事务耗时相加(不考虑并行因素)
    response time(相应时间):
         min最小:                                  2.54ms-- 最小耗时
         avg平均:                                 57.39ms-- 平均耗时
         max最大:                               1074.85ms -- 最长耗时
         approx.  95 percentile:             133.50ms-- 超过99%平均耗时

Threads fairness:
    events (avg/stddev):           1739.2000/35.03
    execution time (avg/stddev):   99.8125/0.05

然后进mysql删除sbtest库

mysql> drop database sbtest;
Query OK, 0 rows affected (0.54 sec)

可以对数据库进行调优后,再使用sysbench对OLTP进行测试,看看TPS是不是会有所提高。 
注意:sysbench的测试只是基准测试,并不能代表实际企业环境下的性能指标。

转自 https://blog.csdn.net/johnstrive/article/details/46610541,如有侵权,请告知并立即删除。
原文地址:https://www.cnblogs.com/chinaops/p/9229923.html