AlertManager下载
https://prometheus.io/download/
解压
添加配置文件test.yml,配置收发邮件邮箱
参考配置:

global:
  smtp_smarthost: 'smtp.163.com:25'  #163服务器
  smtp_from: 'XXX@163.com'        #发邮件的邮箱
  smtp_auth_username: 'XXX@163.com'  #发邮件的邮箱用户名,也就是你的邮箱
  smtp_auth_password: 'XXX'        #发邮件的邮箱密码

route:
  group_by: ['alertname']

  repeat_interval: 1h

  receiver: live-monitoring

receivers:
- name: 'live-monitoring'
  email_configs:
  - to: 'czh1226@qq.com'        #收邮件的邮箱
更多配置参考alertmanager包中的simple.yml
添加报警规则
prometheus targets 监控报警参考配置(node_down.yml):
按 Ctrl+C 复制代码
按 Ctrl+C 复制代码
节点内存使用率监控报警参考配置(memory_over.yml)
groups:
- name: example
  rules:
  - alert: NodeMemoryUsage
    expr: (node_memory_MemTotal_bytes - (node_memory_MemFree_bytes+node_memory_Buffers_bytes+node_memory_Cached_bytes )) / node_memory_MemTotal_bytes * 100 > 80
    for: 1m
    labels:
      user: caizh
    annotations:
      summary: "{{$labels.instance}}: High Memory usage detected"
      description: "{{$labels.instance}}: Memory usage is above 80% (current value is:{{ $value }})"
当然,想要监控节点内存需要提前配置好node_exporter
修改prometheus配置文件prometheus.yml,开启报警功能,添加报警规则配置文件
# Alertmanager configuration
alerting:
  alertmanagers:
  - static_configs:
    - targets: ["localhost:9093"]
      # - alertmanager:9093

# Load rules once and periodically evaluate them according to the global 'evaluation_interval'.
rule_files:
  - "node_down.yml"
  - "memory_over.yml"
配置完成!
启动alertmanager
./alertmanager --config.file test.yml
启动prometheus(默认会调用prometheus.yml)
./prometheus
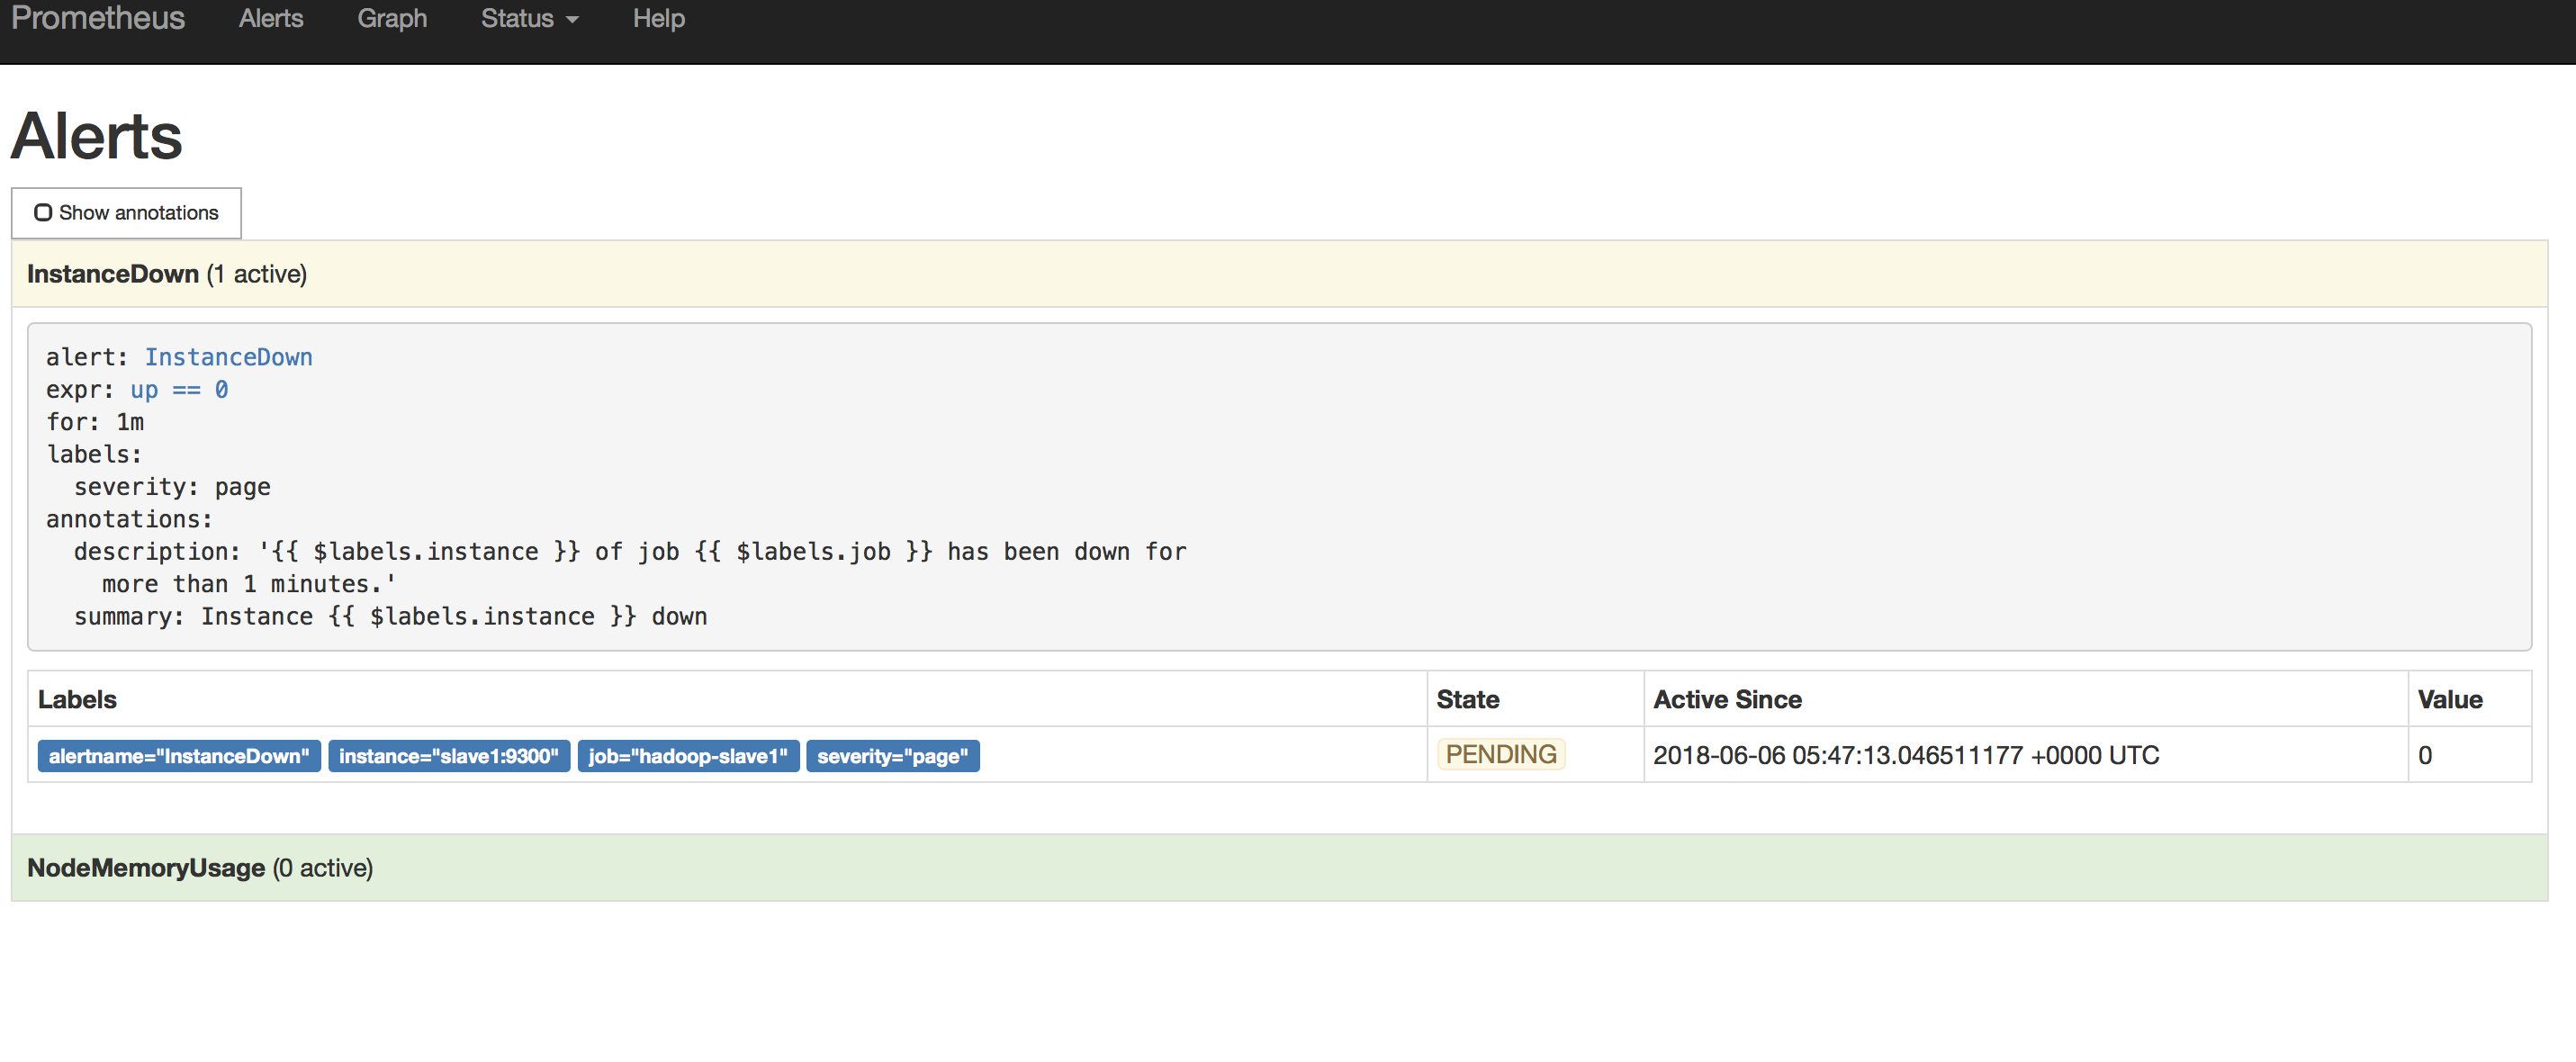
http://localhost:9090/alerts
看配置与报警规则是否添加成功
成功则如下图:

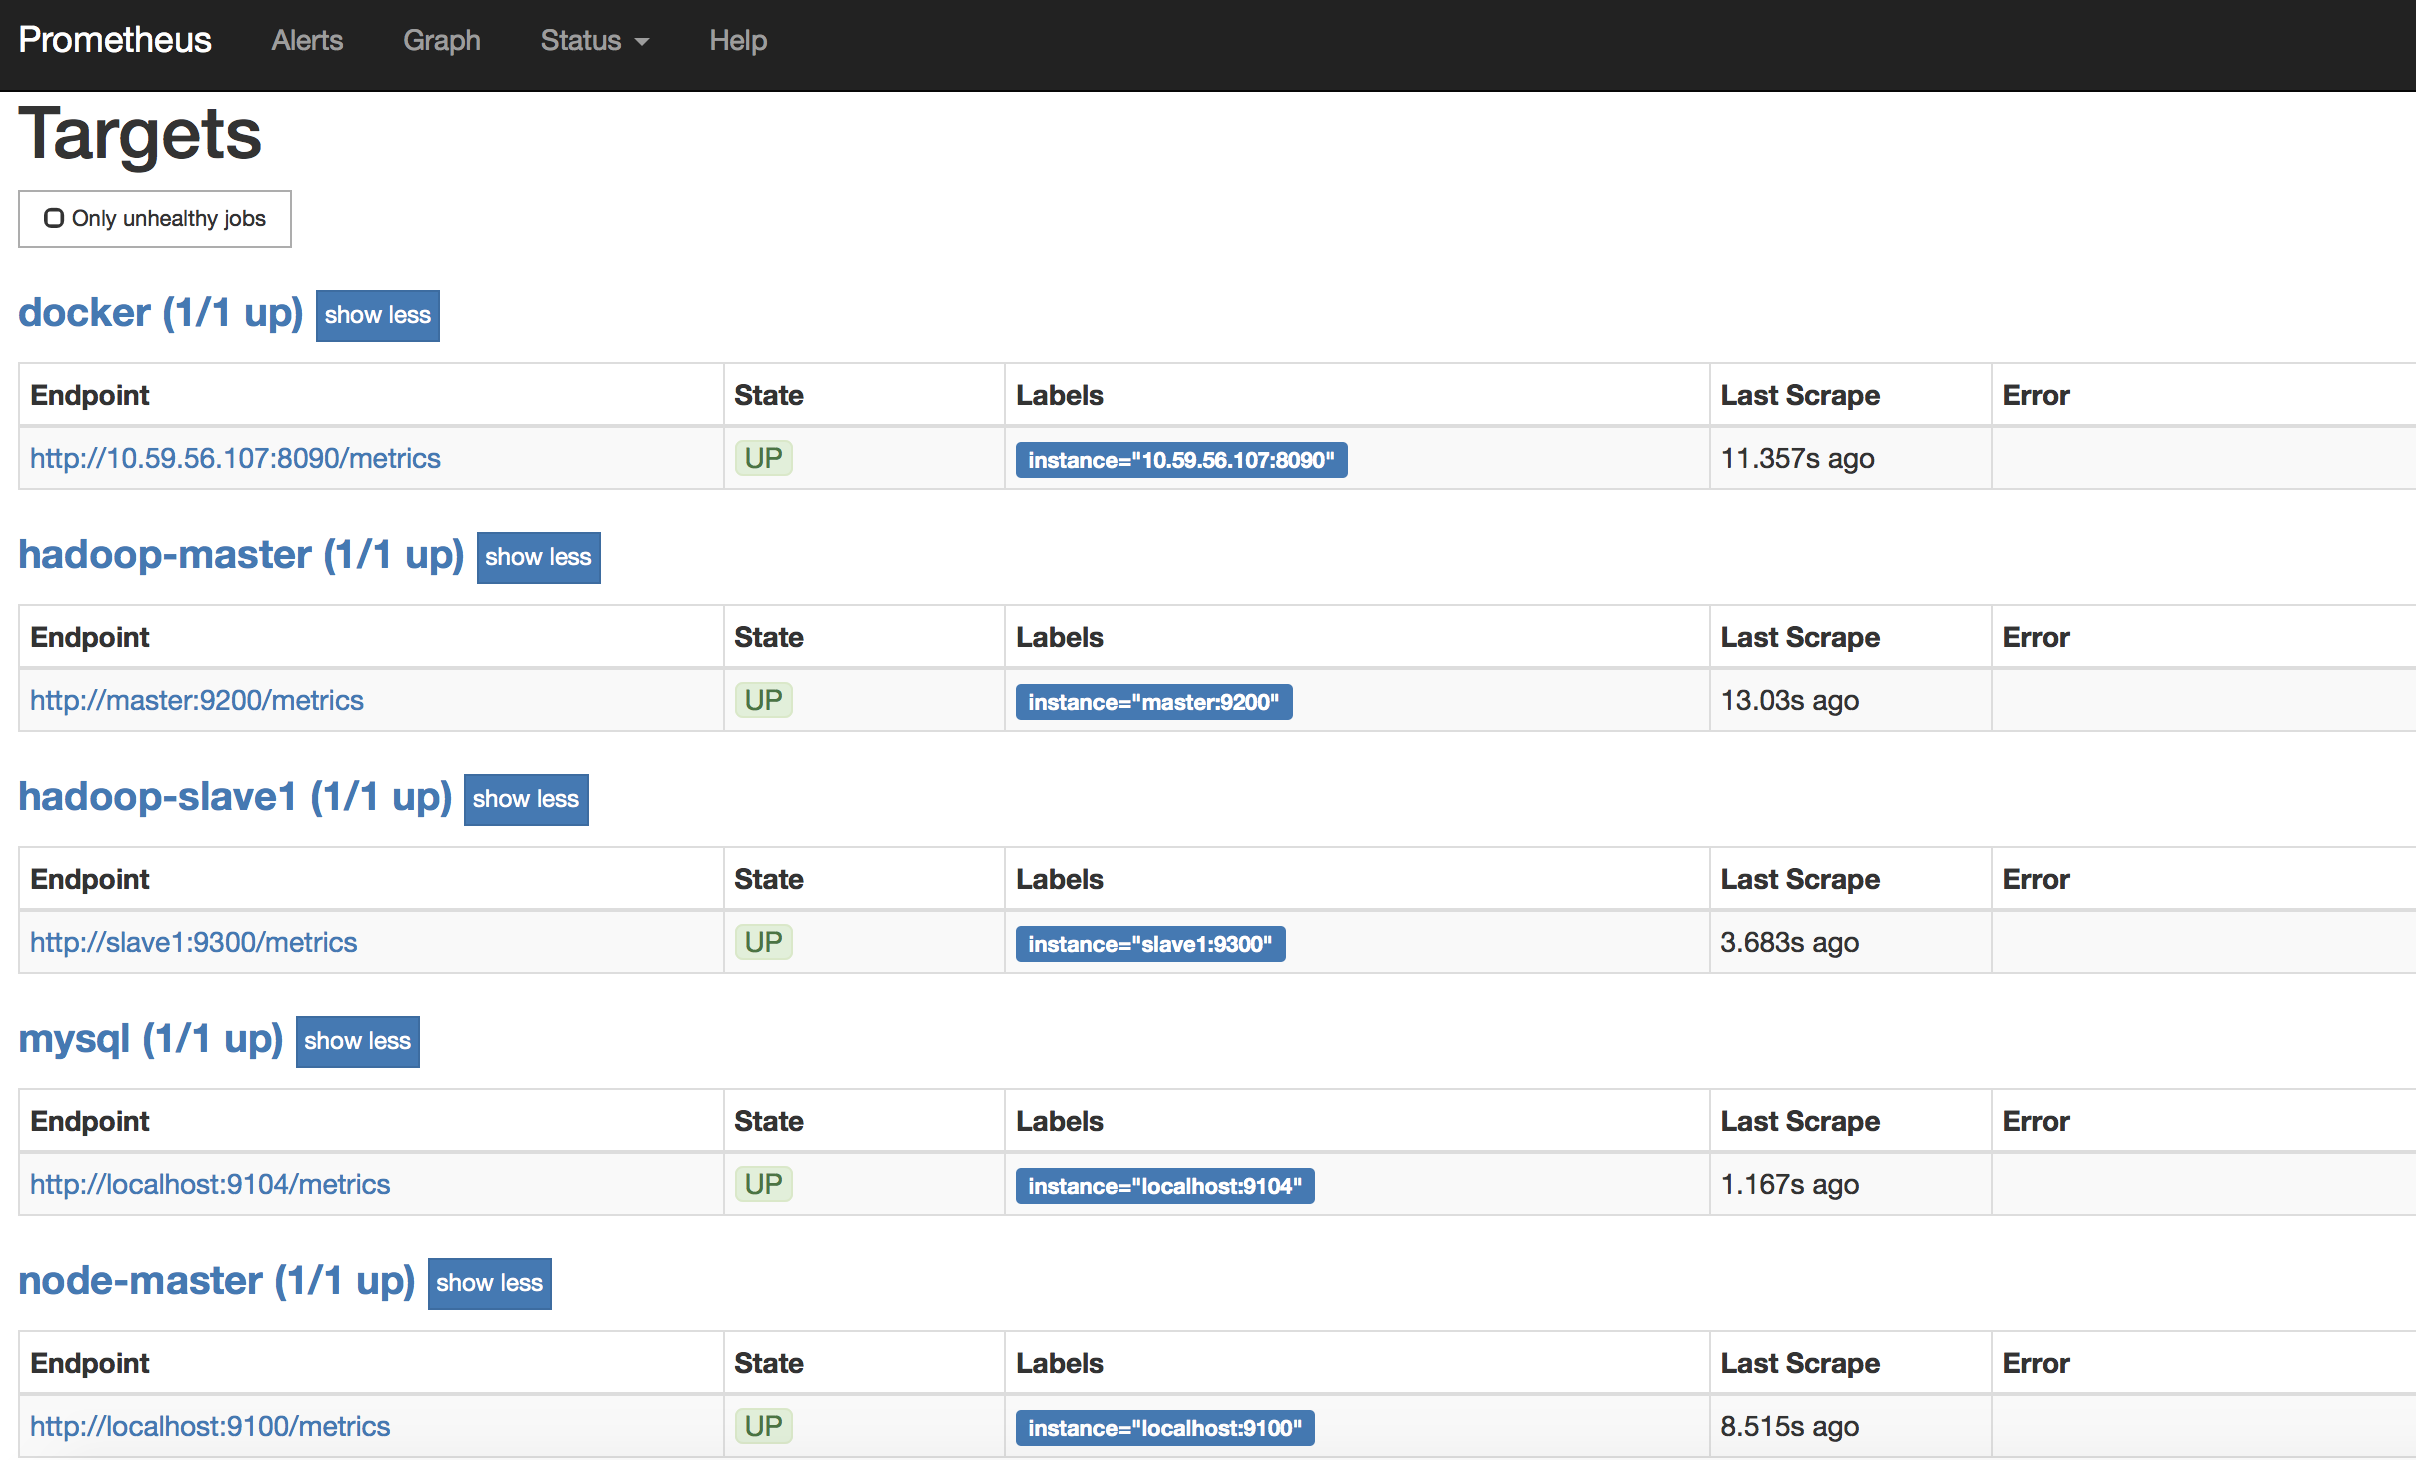
我的Prometheus Targets如下:
尝试kill一个测试是否可以用邮件报警
例如在slave1节点上:
hadoop-daemon.sh stop datanode
InstanceDown会变成(1 active),并处在PENDING状态
1min后变FIRING状态

耐心等待几分钟,会收到报警邮件:

邮件可能会有延时,耐心等一会~
想测试内存使用率可以多开点占内存的服务,或者把报警规则中内存占用超过80%报警调小一些
Over~