| 这个作业属于哪个课程 | 班级链接 |
|---|---|
| 这个作业要求在哪里 | 结队第二次作业 |
| 结对学号 | 221701408、041701124 |
| 这个作业的目标 | 某次疫情统计可视化的实现 |
| 作业正文 | 见下文 |
| 其他参考文献 | 百度,bilibili视频教程,CSDN等 |
1.Github仓库地址和代码规范链接
2.展示成品
-
1.全国疫情曲线图,里面可以看到从1月20到3月12日每日的全国数据(数据和百度疫情大数据相同),并且更加直观,方便
(满足要求的功能1中可以选择具体的日期,查看每日数据)
-
2.在全国地图上使用不同的颜色代表大概确诊人数区间,颜色的深浅表示疫情的严重程度,可以直观了解高危区域;鼠标移到每个省份会高亮显示;点击鼠标会显示该省具体疫情情况

-
3.功能2:点击某个省份显示该省疫情的具体情况,可以看到我们的数据和要求有点不同,因为我们是按照作业给的地图里的数据来爬取的(这一点请见谅)
作业图片里各省数据是现有确诊,累计确诊,累计治愈,累计死亡

作业图片趋势图是新增确诊趋势,累计确诊趋势,累计治愈/死亡趋势

我们的页面:
-
我们爬取到的数据库中34个省的历史数据,从13号开始爬取,到14号只有两天的数据
3.结对讨论过程
拿到题目后,我们遇到的第一个问题是用javaee还是Python,我们选的是python,最主要的原因是只有一个人学了javaee,而网上能查找到的用Python绘制疫情地图的视频比用java更多更详细,比>较方便学习技术和查找资料
关于用助教数据还是爬取数据
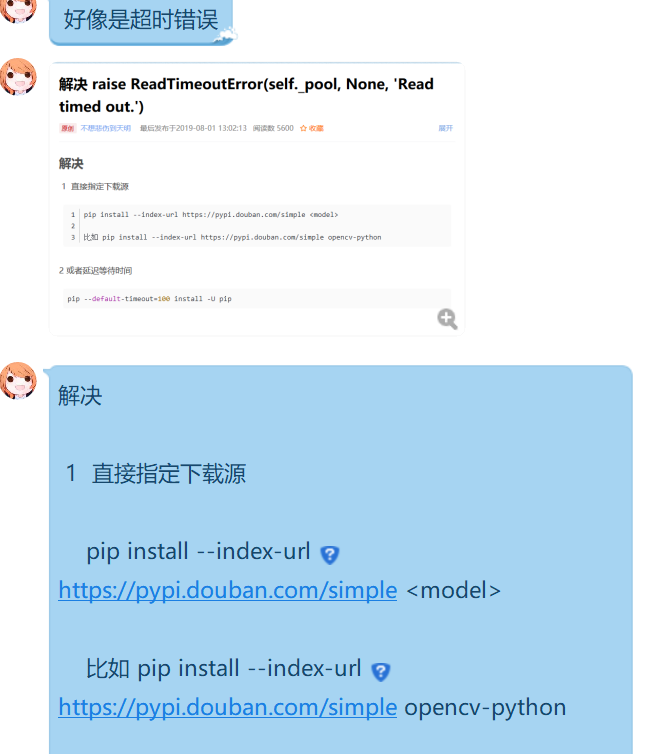
决定用python爬取数据后两人都下了很多遍 jupyter notebook可是都失败了,最终我们换了个豆瓣源下载
之前不停的看教程,找资料,下载开发环境,离截止日期越来越近还一事无成,本打算一人敲一点,给另一人检查后继续敲,不过由于时间不足,加上每天都要上课,我们不得不分块,一人负责爬取数>据+存到数据库+全国疫情曲线,一人负责页面搭建布局+全国每日数据+中国地图部分
腾讯接口里只有各省的每日数据,没有历史数据,只能去34个卫健委官网爬取,而每个官网页面结构又不同,工程量浩大,对于这点我们的解决方法是爬一天数据存一天,就能得到各省的每日数据,不>过因为在编写存储数据库文件出了很多问题,到13号才弄好,截止日期为止各省只有两天的数据
还有一些编译运行遇到的困难


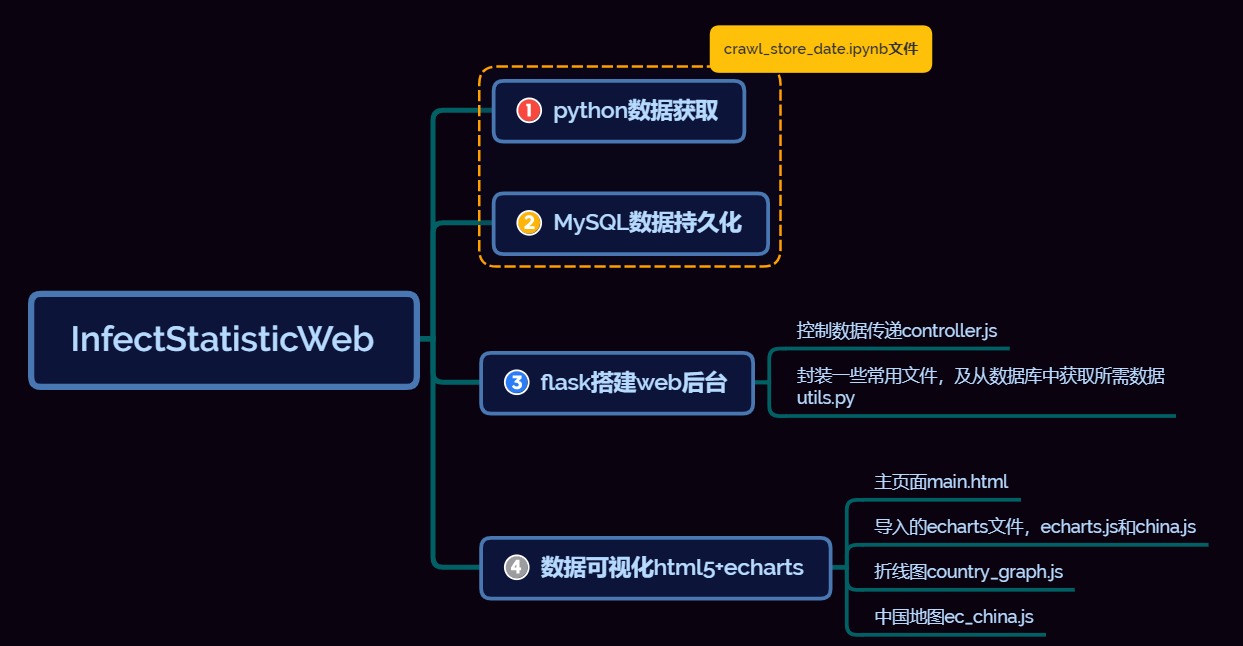
4.设计实现过程
项目用到的技术有Python+MySQL+Flask+Echarts。
- Python爬取腾讯接口数据
- 把数据存到MySQL数据库
- 用Flask构建Web项目
- 用Ajax实现前后台的交互
- 用Echarts实现数据可视化
- 功能结构图
5.代码说明
1.爬取腾讯接口的数据,从两个腾讯接口得到所需数据https://view.inews.qq.com/g2/getOnsInfo?name=disease_h5,和https://view.inews.qq.com/g2/getOnsInfo?name=disease_other。header={}是为了伪装成百度,避免反爬。country_history存每日全国总数据,因为日期不会相同,所以日期可作为主键,用字典暂时存储数据;而province_history无论是日期还是省份都会重复,不适合用字典,所以用了列表暂存。
import requests
import json
import pymysql
import time
import traceback

def getdata():#从腾讯接口爬取数据,并存到字典及列表中
    url = "https://view.inews.qq.com/g2/getOnsInfo?name=disease_h5"
    header = {
    "User-Agent": "Mozilla/5.0 (Windows NT 10.0; WOW64) AppleWebKit/537.36 (KHTML, like Gecko) Chrome/69.0.3947.100 Safari/537.36"
    }
    r1 = requests.get(url,headers = header)
    res1 = json.loads(r1.text)
    data_all = json.loads(res1["data"])

    url2 = "https://view.inews.qq.com/g2/getOnsInfo?name=disease_other"
    r2 = requests.get(url2,headers = header)
    res2 = json.loads(r2.text)
    odata_all = json.loads(res2["data"])

    country_history = {}#历史数据,全国
    for i in odata_all["chinaDayList"]:
        ds ="2020."+ i["date"]
        tup =time.strptime(ds,"%Y.%m.%d")
        ds =time.strftime("%Y-%m-%d",tup)
        confirm =i["confirm"]
        heal=i["heal"]
        dead=i["dead"]
        country_history[ds] ={"confirm":confirm, "heal":heal, "dead":dead}
    for i in odata_all["chinaDayAddList"]:
        ds ="2020."+ i["date"]
        tup =time.strptime(ds,"%Y.%m.%d")
        ds =time.strftime("%Y-%m-%d",tup)
        confirm =i["confirm"]
        country_history[ds].update({"confirm_add":confirm})

    details =[]#各省数据
    update_time=data_all["lastUpdateTime"]
    data_province=data_all["areaTree"][0]["children"]
    for pro_infos in data_province:
        province=pro_infos["name"]
        confirm=pro_infos["total"]["confirm"]
        confirm_add=pro_infos["today"]["confirm"]
        heal=pro_infos["total"]["heal"]
        dead=pro_infos["total"]["dead"]
        details.append([update_time,province,confirm,confirm_add,heal,dead])

    country_now =[]#全国如今数据
    update_time =data_all["lastUpdateTime"]
    nowConfirm =data_all["chinaTotal"]["nowConfirm"]
    suspect =data_all["chinaTotal"]["suspect"]
    nowSevere =data_all["chinaTotal"]["nowSevere"]
    confirm =data_all["chinaTotal"]["confirm"]
    heal =data_all["chinaTotal"]["heal"]
    dead =data_all["chinaTotal"]["dead"]
    nowConfirm_add =data_all["chinaAdd"]["nowConfirm"]
    suspect_add =data_all["chinaAdd"]["suspect"]
    nowSevere_add =data_all["chinaAdd"]["nowSevere"]
    confirm_add =data_all["chinaAdd"]["confirm"]
    heal_add =data_all["chinaAdd"]["heal"]
    dead_add =data_all["chinaAdd"]["dead"]
    country_now.append([update_time,nowConfirm,suspect,nowSevere,confirm,heal,dead,nowConfirm_add,suspect_add,nowSevere_add,confirm_add,heal_add,dead_add])

    province_history = []#历史数据,各省
    ds=time.strftime("%Y-%m-%d")
    data_province=data_all["areaTree"][0]["children"]
    for pro_infos in data_province:
        province=pro_infos["name"]
        confirm=pro_infos["total"]["confirm"]
        confirm_add=pro_infos["today"]["confirm"]
        heal=pro_infos["total"]["heal"]
        dead=pro_infos["total"]["dead"]
        province_history.append([ds,province,confirm,confirm_add,heal,dead])

    return country_history,details,country_now,province_history
2.建表,为了方便队友运行代码,所以把数据库建表命令封装成一个方法,如果用云数据库就不用这些操作了,不过我们只有本地数据库localhost,所以要运行项目必须从crawl_store_date.ipynb爬取到数据存到数据库
def get_conn():#把常用的函数封装,打开关闭数据库链接
    conn=pymysql.connect(host="localhost",
                     user="root",
                     password="123456",
                     db="covtest",
                     charset="utf8")
    cursor=conn.cursor()
    return conn,cursor

def close_conn(conn,cursor):
    if cursor:
        cursor.close()
    if conn:
        conn.close()

def create_table():#在数据库中创建四张表,其实建表我是直接用命令行的,不过测试了一下函数可用
    cursor=None
    conn=None
    try:
        conn,cursor=get_conn()
        sql1 ="""
        CREATE TABLE `country_history` (
            `ds` datetime NOT NULL COMMENT '日期',
            `confirm` int(11) DEFAULT NULL COMMENT '累计确诊',
            `heal` int(11) DEFAULT NULL COMMENT '累计治愈',
            `dead` int(11) DEFAULT NULL COMMENT '累计死亡',
            `confirm_add` int(11) DEFAULT NULL COMMENT '新增确诊',
            PRIMARY KEY (`ds`) USING BTREE
            )ENGINE=InnoDB DEFAULT CHARSET=utf8mb4;
               """
        cursor.execute(sql1)
        #conn.commit()sql1 ="""
        print("建表country_history成功")

        sql2 ="""
        CREATE TABLE `details`(
                  `id` int(11) NOT NULL AUTO_INCREMENT,
                  `update_time` datetime DEFAULT NULL COMMENT '数据更新时间',
                  `province` varchar(50) DEFAULT NULL COMMENT '省名',
                  `confirm` int(11) DEFAULT NULL COMMENT '累计确诊',
                  `confirm_add` int(11) DEFAULT NULL COMMENT '新增确诊',
                  `heal` int(11) DEFAULT NULL COMMENT '累计治愈',
                  `dead` int(11) DEFAULT NULL COMMENT '累计死亡',
                  PRIMARY KEY (`id`)
                  )ENGINE=InnoDB DEFAULT CHARSET=utf8mb4;
               """
        cursor.execute(sql2)
        #conn.commit()
        print("建表details成功")

        sql3 ="""
        CREATE TABLE `country_now` (
                  `id` int(11) NOT NULL AUTO_INCREMENT,
                  `update_time` datetime DEFAULT NULL COMMENT '数据更新时间',
                  `nowConfirm` int(11) DEFAULT NULL COMMENT '现存确诊',
                  `suspect` int(11) DEFAULT NULL COMMENT '现存疑似',
                  `nowSevere` int(11) DEFAULT NULL COMMENT '现存重症',
                  `confirm` int(11) DEFAULT NULL COMMENT '累计确诊',
                  `heal` int(11) DEFAULT NULL COMMENT '累计治愈',
                  `dead` int(11) DEFAULT NULL COMMENT '累计死亡',
                  `nowConfirm_add` int(11) DEFAULT NULL COMMENT '新增现存确诊',
                  `suspect_add` int(11) DEFAULT NULL COMMENT '新增现存疑似',
                  `nowSevere_add` int(11) DEFAULT NULL COMMENT '新增现存重症',
                  `confirm_add` int(11) DEFAULT NULL COMMENT '新增累计确诊',
                  `heal_add` int(11) DEFAULT NULL COMMENT '新增累计治愈',
                  `dead_add` int(11) DEFAULT NULL COMMENT '新增累计死亡',
                  PRIMARY KEY (`id`)
                  )ENGINE=InnoDB DEFAULT CHARSET=utf8mb4;
               """
        cursor.execute(sql3)
        #conn.commit()
        print("建表country_now成功")

        sql4 ="""
        CREATE TABLE `province_history` (
                  `id` int(11) NOT NULL AUTO_INCREMENT,
                  `ds` datetime NOT NULL COMMENT '日期',
                  `province` varchar(50) DEFAULT NULL COMMENT '省名',
                  `confirm` int(11) DEFAULT NULL COMMENT '累计确诊',
                  `confirm_add` int(11) DEFAULT NULL COMMENT '新增累计确诊',
                  `heal` int(11) DEFAULT NULL COMMENT '累计治愈',
                  `dead` int(11) DEFAULT NULL COMMENT '累计死亡',
                   PRIMARY KEY (`id`)
                  )ENGINE=InnoDB DEFAULT CHARSET=utf8mb4;
               """
        cursor.execute(sql4)
        #conn.commit()
        print("建表province_history成功")
    except:
        traceback.print_exc()
    finally:
        close_conn(conn,cursor)
3.存数据,每个表的更新都差不多,这里就展示比较特殊的那个用字典封装的country_history表,因为它有两个函数,第一次插入数据运行插入函数,之后都是运行更新的函数.
注意这个dic.items()目前是{ds[comfirm,heal,dead,confirm_add]}的形式,getdata()[0]返回的就是country_history。
def insert_country_history():#country_history第一次储存爬取数据时用该函数
    cursor = None
    conn = None
    try:
        dic = getdata()[0]
        print(f"{time.asctime()}开始插入历史数据")
        conn, cursor = get_conn()
        sql = "insert into country_history values(%s,%s,%s,%s,%s)"
        for k, v in dic.items():
            cursor.execute(sql,
                           [k, v.get("confirm"), v.get("heal"), v.get("dead"), v.get("confirm_add")])
        conn.commit()
        print(f"{time.asctime()}插入历史数据完毕")
    except:
        traceback.print_exc()
    finally:
        close_conn(conn, cursor)

def update_country_history():#country_history除了第一次储存数据,都用该函数更新
    cursor = None
    conn = None
    try:
        dic = getdata()[0]
        print(f'{time.asctime()}开始更新历史数据')
        conn, cursor = get_conn()
        sql = "insert into country_history values(%s,%s,%s,%s,%s)"
        sql_query = "select confirm from country_history where ds=%s"
        for k, v in dic.items():
            if not cursor.execute(sql_query, k):
                cursor.execute(sql, [k, v.get("confirm"), v.get("heal"), v.get("dead"), v.get("confirm_add")])
        conn.commit()
        print(f"{time.asctime()}历史数据更新完毕")
    except:
        traceback.print_exc()
    finally:
        close_conn(conn, cursor)
4.前端的.html页面和它的.css文件就不进行介绍了,就是几个div模块。然后现在就来讲怎么从数据库中提取数据到后台,后台又是怎么传到前台的,不管是中国地图,还是曲线图,或者页首的六个每日全国数据流程都差不多。所以就挑曲线图来说明吧。按照官方echarts的教程,初始化然后修改并复制曲线图的option,setOption()运行
var country_graph = echarts.init(document.getElementById('graph'),"dark");

var country_graph_Option ={
    title: {
        text: '全国疫情趋势'
    },
    tooltip: {
        trigger: 'axis'
    },
    legend: {
        data: ['累计确诊', '新增确诊', '累计治愈', '累计死亡'],
        left: "right"
    },
    grid: {
        left: '3%',
        right: '4%',
        bottom: '3%',
        containLabel: true
    },
    toolbox: {
        feature: {
            saveAsImage: {}
        }
    },
    xAxis: {
        type: 'category',
        boundaryGap: false,
        data: []
    },
    yAxis: {
        type: 'value'
    },
    series: [
        {
            name: '累计确诊',
            type: 'line',
            stack: '总量',
            data: []
        },
        {
            name: '新增确诊',
            type: 'line',
            stack: '总量',
            data: []
        },
        {
            name: '累计治愈',
            type: 'line',
            stack: '总量',
            data: []
        },
        {
            name: '累计死亡',
            type: 'line',
            stack: '总量',
            data: []
        }
    ]
}
 country_graph.setOption(country_graph_Option);
sql语句获取数据库数据
def query(sql,*args):
    conn,cursor=get_conn()
    cursor.execute(sql,args)
    res=cursor.fetchall()
    close_conn(conn,cursor)
    return res


def get_graph_data():#获取中国曲线图所需疫情数据
    sql="select ds,confirm,confirm_add,heal,dead from country_history "
    res=query(sql)
    return res
在app.py文件中调用数据库获得的数据,并以jsonify格式传给controller.js文件
@app.route('/')
def hello_world():
    return render_template("main.html")


@app.route("/graph")
def get_graph_data():
    data=utils.get_graph_data()
    day,confirm,confirm_add,heal,dead=[],[],[],[],[]
    for a,b,c,d,e in data[7:]:
        day.append(a.strftime("%m-%d"))
        confirm.append(b)
        confirm_add.append(c)
        heal.append(d)
        dead.append(e)
    return jsonify({"day":day,"confirm":confirm,"confirm_add":confirm_add,"heal":heal,"dead":dead})
如何ajax更新前台曲线图的数据,这样就能做到数据库一更新,曲线图也会随数据改变而改变
function get_graph_data(){
    $.ajax({
	url:"/graph",
	/*timeout:10000,//超时时间设置为10秒;*/
	success:function(data){
		country_graph_Option.xAxis.data=data.day
        country_graph_Option.series[0].data=data.confirm
        country_graph_Option.series[1].data=data.confirm_add
        country_graph_Option.series[2].data=data.heal
        country_graph_Option.series[3].data=data.dead
        country_graph.setOption(country_graph_Option)
	},
	error:function(xhr,type,errorThrown){
		print(error)

	},
});
}

get_graph_data()
6.心路历程与收获并评价结对队友
心路历程与收获
- 221701408
说实话做原型设计的时候就预料到会有要求用代码的一天,不过那个时候以为原型设计会和代码合起来(果然没有做过产品啊),所以收到第二次作业的要求时本人还是比较淡定的,就是有点惊讶时间给的太短,因为开学了课不少,再加上几乎都是早上下午的课。而第一次团队合作的时候我们都是整个下午用来讨论和完成任务的,这就意味着上次合作的定下的习惯没用了,不过那时因为刚开始,我们都没意识到这点。果然前三天我们上课上到下午四点,五点半吃饭,每天讨论的时间只有1个半小时。任务做了什么,当然是什么都没做了,因为我和队友都不是代码水平特别好的人,队友也是刚开始学习javaee后台,而我更是对数据前后端怎么交互的一点概念都没有,python也是一点都没学过,所以前几天的晚上都在爬虫速成,以及看网上的如何制作动态全国可视化疫情地图等一系列视频,好在这部分视频不少,多嚼几遍视频就理解了。用了一天时间安装各种编译器开发环境。后来我们视频什么都看完,也有思路了,编译器什么也搭建好了,万事俱备看似只欠东风,结果。。。。。。噢,要凉只剩下三天了,糟糕的是队友第二天从早到晚都有课。那时我终于意识到我们最大的问题,看起来从一开始就开始做了,每天也有留任务,晚上的时间也没闲着,但是我们对每天的任务没有硬性规定,像视频啊资料什么的没看完就继续看,但是原本自己是打算一天看完就开始敲代码的,自己并没有做到,显然队友也没有。一起做的太多,就可能一起懈怠,所以任务的分工必须明确,规定每天做多少量就必须做完。后面代码bug等等确实出了不少问题,不过因为后来分了模块而不是单纯的一人做前端一人做后端,所以自己的代码能不能跑自己一下就清楚了,不过这样也有一个问题,就是在水平不够的情况下,一人的出错另一人很难发现是哪里的错误。这次的收获大概就是对团队是怎么合作的有了更深的理解,一定要再最开始就有一个人对大概要做什么了解,如何平均分配任务。
- 041701124
刚看到这个作业的时候感觉难得要死,还要做网页还要跳转还要实时修改什么的,感觉人生都迷茫了,但是找完资料学完感觉虽然还是很难但是至少没有到不能接受的难度了。通过这次作业大概了解了python,也复习了一些上学期学的css和html,也知道了应该怎么在网页里调用echart

对队友的评价
- 221701408
对我的队友我还是满意的,脾气很好,哈哈哈哈哈,感觉脾气比我好。
队友水平还是有的,感觉比我水平高,也比我勤奋。如果没有他,我可能最后三天才会开始做,有队友就是有个人会一直督促着你一定要完成任务,不要拖累了伙伴。或许这就团队的意义,如果任务做>不完,是两个人的事,而不是一个人。

- 041701124
队友就很强,是大佬,比我效率不知道高到哪里去,做了好多东西,如果只有我自己做这个作业大概做到一半会放弃吧