看文献时,翻到一张保守性得分图:
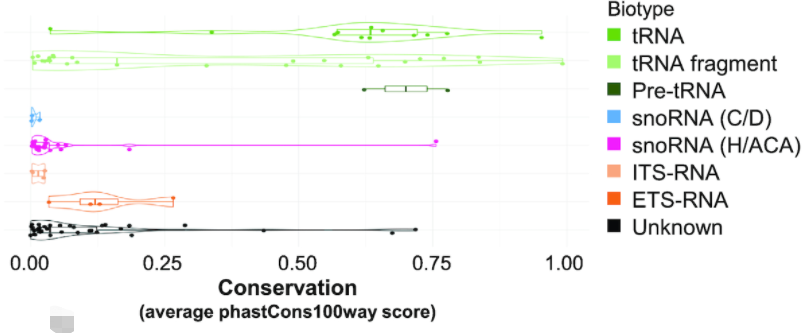
图片来源:Reducing the structure bias of RNA-Seq reveals a large number of non-annotated non-coding RNA
原文描述:As expected, the most conserved group of NA_RNAs are the tRNAs, tRNA fragments and pre-tRNAs, with most tRNA conserved at least as far as the opossum (Monodelphis domestica). This is to be expected as tRNAs are the most highly conserved ncRNA class across all domains of life
刚好需要计算保守性得分,搜了下,有R包支持。
OK,这就上手。
1、安装、加载 phastCons100way.UCSC.hg19 包
BiocManager::install("phastCons100way.UCSC.hg19")
library(GenomicRanges)
library(phastCons100way.UCSC.hg19)
ls("package:.UCSC.hg19")
phast <- phastCons100way.UCSC.hg19
注意,这个包是hg19版本的哦,也就是说你输入的基因组位置对应的版本也是hg19。别在这种小细节上犯错。
2、计算指定区域的平均保守性得分
比如计算7号染色体基因组区域117232380到117232384的平均保守性得分:
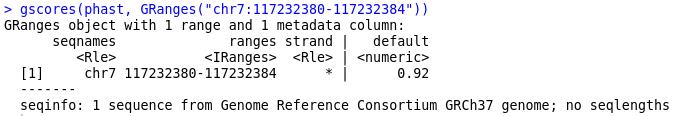
gscores(phast, GRanges("chr7:117232380-117232384"))
该命令也可以写成:
gscores(phast, GRanges(seqnames="chr7", IRanges(start=117232380, width=5)))
结果是一样的。
显示chr7:117232380-117232384区段平均保守性得分为0.92:
3、计算指定区域的保守性得分
计算7号染色体基因组区域117232380到117232384的保守性得分:
gscores(phast, GRanges(seqnames="chr7", IRanges(start=117232380:117232384, width=1)))
显示chr7:117232380-117232384区段每个碱基的保守性得分:

可以看到 (0.8+0.8+1+1+1)/5=0.92,与第2步计算出来的平均保守性得分是一致的。
4、计算多个区域的平均保守性得分
计算基因组区域chr7:117232380-117232384、chr2:115262390-115262395、chr3:19597000-19597005的平均保守性得分:
gscores(phast, GRanges(c("chr7:117232380-117232384","chr2:115262390-115262395","chr3:19597000-19597005")))
结果如下所示:

5、结果怎么看
分值越高,越保守咯~
