Pandas的使用(2)
1.新建一个空的DataFrame数据类型
total_price = pd.DataFrame() #新建一个空的DataFrame
2.向空的DataFrame中逐行添加数据
realtime_price = ts.get_realtime_quotes(i) #得到股票当前价格
realtime_price_1 = realtime_price[['code','name','price','time']]
total_price = total_price.append(realtime_price_1,ignore_index=True) #ignore_index这个参数很重要
3.将AxesSubPlot类型的图片信息保存下来
根据stackoverflow上的解决方案:

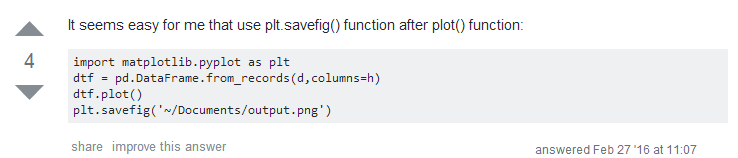
则运用到程序中为:
import matplotlib.pyplot as plt
df_4.plot(title=i,figsize=(60,18))
plt.savefig('E:stock_' + i + '.png')
4.绘制金融行业所有股票一年内的复权价格曲线图
import pandas as pd
import tushare as ts
import matplotlib.pyplot as plt

df_1 = ts.get_industry_classified()
df_2 = df_1[df_1.c_name == '金融行业'] #找出属于金融行业的股票
stock_series = df_2['code'] #获取金融行业的股票代码
stock_series.to_csv('E:金融行业.csv')
total_price = pd.DataFrame() #新建一个空的DataFrame

for i in stock_series:  #对这些股票依次进行处理
    realtime_price = ts.get_realtime_quotes(i) #得到股票当前价格
    realtime_price_1 = realtime_price[['code','name','price','time']]
    total_price = total_price.append(realtime_price_1,ignore_index=True)
    df_3 = ts.get_h_data(i) #得到各支股票近一年的复权数据
    df_4 = df_3[['open','high','close','low']] #只需要开盘价,收盘价,最高价
    df_4.plot(title=i,figsize=(60,18))
    plt.savefig('E:stock_' + i + '.png')