在d3中并不没有什么方法能直接获取到两条line、path或两个其他图形的交点,所以我们借助2D.js帮助我们计算交点。
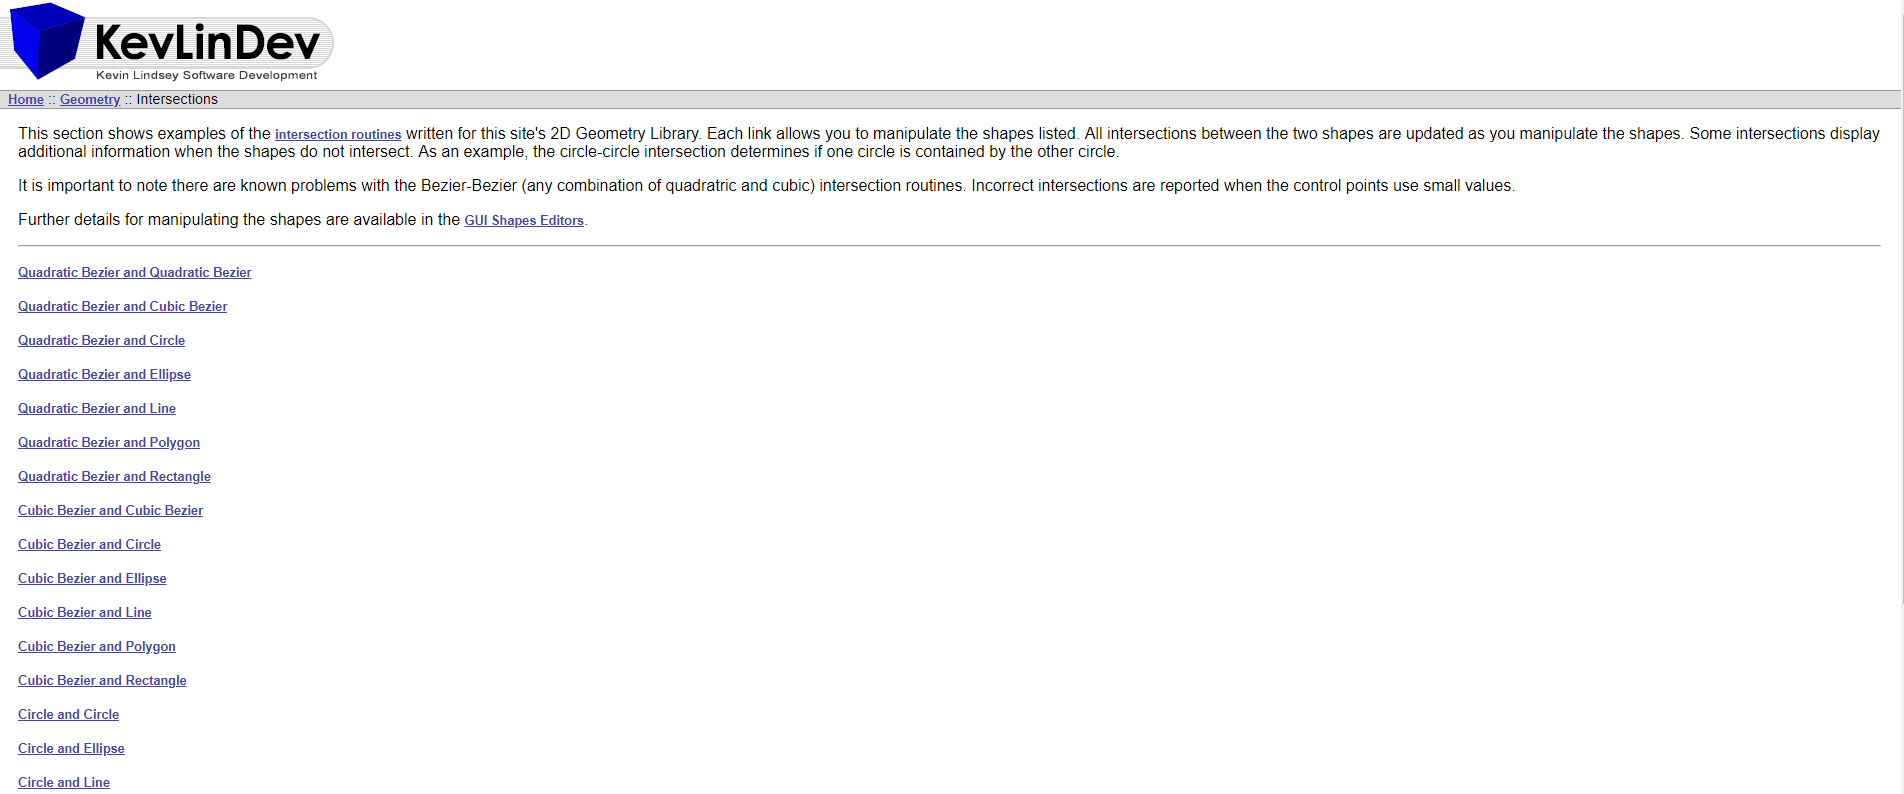
2D.js
- From kevlindev
- 以两条线的为例
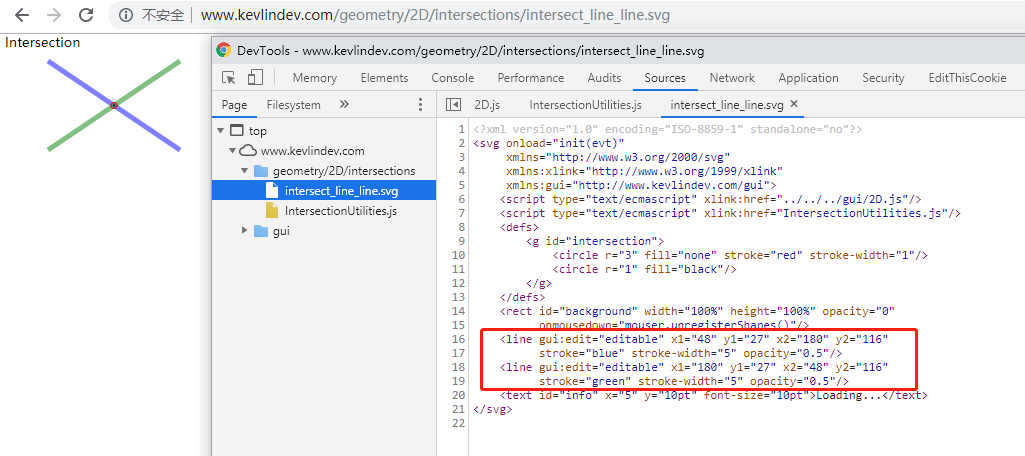
- 获取
svg中两条line并初始化
- 通过
Intersection.intersectShapes来计算交点

绘制交点
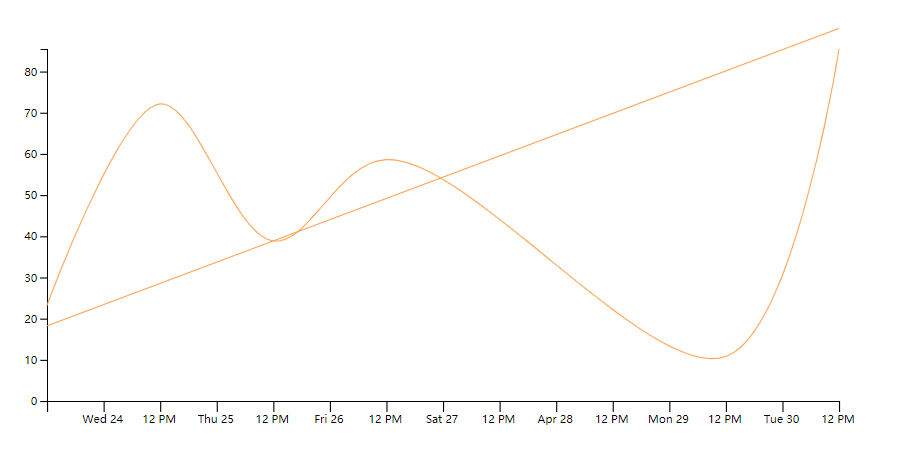
- 以直线和曲线为例,先绘制图形。
<!DOCTYPE html>
<html>

	<head>
		<meta charset="UTF-8">
		<title></title>
	</head>

	<body>
		<div id="test-svg">
		</div>
	</body>
	<script src="https://d3js.org/d3.v5.js"></script>
	<script type="text/javascript" src="js/2D.js"></script>
	<script>
		window.onload = function() {

			// 数据
			var data = [{
				date: new Date(2019, 3, 24),
				value: 23.24
			}, {
				date: new Date(2019, 3, 25),
				value: 72.15
			}, {
				date: new Date(2019, 3, 26),
				value: 38.84
			}, {
				date: new Date(2019, 3, 27),
				value: 58.62
			}, {
				date: new Date(2019, 3, 30),
				value: 10.80
			}, {
				date: new Date(2019, 4, 1),
				value: 85.47
			}];

			var data2 = [{
				date: new Date(2019, 3, 24),
				value: 18.24
			}, {
				date: new Date(2019, 4, 1),
				value: 90.47
			}];

			var width = 800,
				height = 400,
				padding = {
					top: 40,
					right: 40,
					bottom: 40,
					left: 40
				};

			var colors = d3.schemeSet2;
			var svg = d3.select("#test-svg")
				.append('svg')
				.attr('width', width + 'px')
				.attr('height', height + 'px');

			// x轴:时间轴
			var xScale = d3.scaleTime()
				.domain(d3.extent(data, function(d) {
					return d.date;
				}))
				.range([padding.left, width - padding.right]);

			var xAxis = d3.axisBottom()
				.scale(xScale)
				.tickSize(10);

			svg.append('g')
				.call(xAxis)
				.attr("transform", "translate(0," + (height - padding.bottom) + ")")
				.selectAll("text")
				.attr("font-size", "10px")
				.attr("dx", "50px");

			var ymax = d3.max(data, function(d) {
				return d.value;
			});

			// y轴
			var yScale = d3.scaleLinear()
				.domain([0, ymax])
				.range([height - padding.bottom, padding.top]);

			var yAxis = d3.axisLeft()
				.scale(yScale)
				.ticks(10);

			svg.append('g')
				.call(yAxis)
				.attr("transform", "translate(" + padding.left + ",0)");

			// 曲线
			var curveLine = d3.line()
				.x(function(d) {
					return xScale(d.date);
				})
				.y(function(d) {
					return yScale(d.value);
				})
				.curve(d3.curveCatmullRom.alpha(0.5));

			// 直线
			var line = d3.line()
				.x(function(d) {
					return xScale(d.date);
				})
				.y(function(d) {
					return yScale(d.value);
				});

			var container = svg.append("g");

			container.append("path")
				.datum(data)
				.attr("d", curveLine)
				.attr("class", "cmn")
				.attr('stroke', '#FFA354')
				.attr("fill", "none");

			container.append("path")
				.datum(data2)
				.attr("d", line)
				.attr("class", "csmn")
				.attr('stroke', '#FFA354')
				.attr("fill", "none");


		}
	</script>

</html>
-
使用2D.js获取绘制交点
-
Intersection.intersectShapes(shapes[0], shapes[1])

var shapes = [];

			var children = container.selectAll("path");

            // 获取path
			for(var i = 0; i < children._groups[0].length; i++) {
				var child = children._groups[0][i];
				var shape = new Path(child);
				shapes.push(shape);
			}

            // 计算交点
			var inter = Intersection.intersectShapes(shapes[0], shapes[1]);

            // 绘制交点
			svg.selectAll("circle")
				.data(inter.points)
				.join("circle")
				.attr("r", 3)
				.attr("cx", function(d) {
					return d.x;
				})
				.attr("cy", function(d) {
					return d.y;
				})
				.attr("fill", "steelblue");
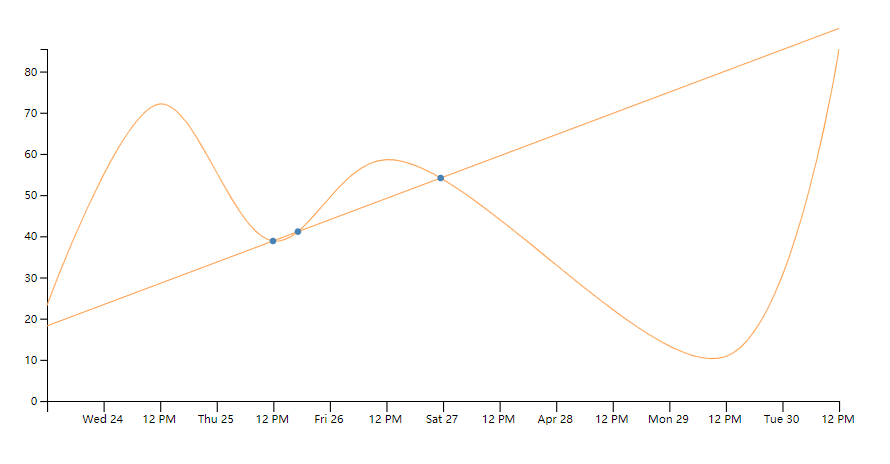
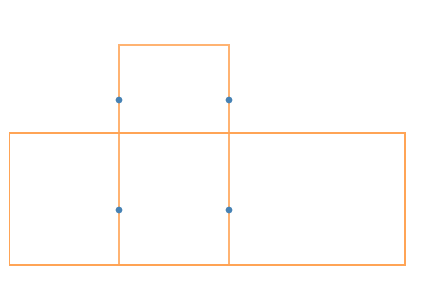
同理也可以使用两个图形
- 两个
rect
svg.append("rect")
				.attr("x", 100)
				.attr("y", 100)
				.attr("width", 100)
				.attr("height", 200)
				.attr("fill", "none")
				.attr('stroke', '#FFA354')
				.attr('stroke-width', 1.5);

			svg.append("rect")
				.attr("x", 0)
				.attr("y", 150)
				.attr("width", 300)
				.attr("height", 100)
				.attr("fill", "none")
				.attr('stroke', '#FFA354')
				.attr('stroke-width', 1.5);

			var shapes = [];

			var children = svg.selectAll("rect");

            // 获取path
			for(var i = 0; i < children._groups[0].length; i++) {
				var child = children._groups[0][i];
				var shape = new Rectangle(child);
				shapes.push(shape);
			}

            // 计算交点
			var inter = Intersection.intersectShapes(shapes[0], shapes[1]);

            // 绘制交点
			svg.selectAll("circle")
				.data(inter.points)
				.join("circle")
				.attr("r", 3)
				.attr("cx", function(d) {
					return d.x;
				})
				.attr("cy", function(d) {
					return d.y;
				})
				.attr("fill", "steelblue");
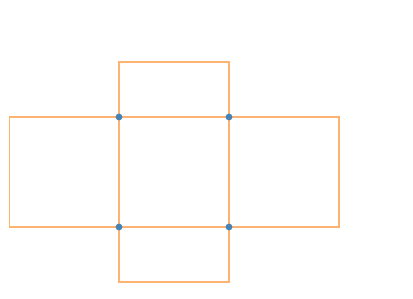
- 注:旋转和缩放后可能会存在问题,计算出的交点还是没有操作之前的。
.attr('transform','rotate(30)')
.attr('transform','scale(1.2,1.2)')