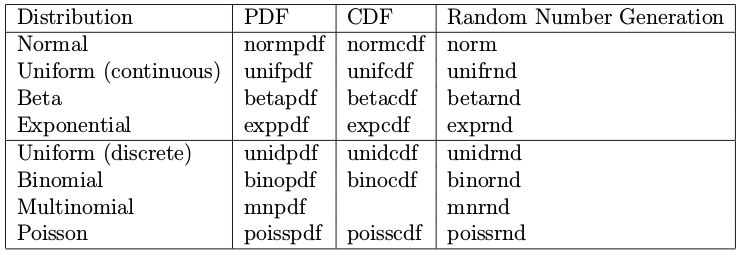
Matlab built-in distributions are all standard distributions, See the summarization below.
Solutions for 1.1.
I‘ve implemented those distributions: illustrate PDF, CDF; Draw random values from them.
(0) Univariate Norm
 1 mu= 102; sigma = 15; % mean and standard deviation
 2 xmin = 70; xmax = 130; % x limitation for pdf and cdf plot
 3 n= 100; % number of points for pdf and cdf plot
 4 k= 10000; % number of random draws for histogram
 5
 6 x= linspace( xmin , xmax , n );%create a set of values ranging from xmin to xmax
 7 p= normpdf( x , mu , sigma ); % calculate the pdf
 8 c= normcdf( x , mu , sigma ); % calculate the cdf
 9
10 figure( 1 ); clf; % create a new figure and clear the contents
11 subplot( 1,3,1 );
12 plot(x,p);
13 xlabel( 'x' ); ylabel( 'pdf' );
14 title( 'Probability Density Function' );
15
16 subplot( 1,3,2 );
17 plot( x , c );
18 xlabel( 'x' ); ylabel( 'cdf' );
19 title( 'Cumulative Density Function' );
20
21 subplot( 1,3,3 );
22 %draw k random numbers from a N( mu , sigma ) distribution
23 %here the argument "1" means
24 y = normrnd( mu , sigma , k , 1 );
25 hist( y , 20 );%20 bars
26 xlabel( 'x' ); ylabel( 'frequency' );
27 title( 'Histogram of random values' );
28
29 pause;
(1) Beta
 1 alpha= 2; beta = 3; %parameters
 2 xmin = 0; xmax = 1; % x limitation for pdf and cdf plot
 3 n= 100; % number of points for pdf and cdf plot
 4 k= 10000; % number of random draws for histogram
 5
 6 x= linspace( xmin , xmax , n );%create a set of values ranging from xmin to xmax
 7 p= betapdf( x , alpha , beta ); % calculate the pdf
 8 c= betacdf( x , alpha , beta); % calculate the cdf
 9
10 figure( 1 ); clf; % create a new figure and clear the contents
11 subplot( 1,3,1 );
12 plot(x,p);
13 xlabel( 'x' ); ylabel( 'pdf' );
14 title( 'Probability Density Function' );
15
16 subplot( 1,3,2 );
17 plot( x , c );
18 xlabel( 'x' ); ylabel( 'cdf' );
19 title( 'Cumulative Density Function' );
20
21 subplot( 1,3,3 );
22 %draw k random numbers from a N( mu , sigma ) distribution
23 %here the argument "1" means
24 y = betarnd( alpha , beta , k , 1 );
25 hist( y , 20 );%20 bars
26 xlabel( 'x' ); ylabel( 'frequency' );
27 title( 'Histogram of random values' );
28
29 pause;
(1) Exponential
 1 gamma=2; % parameters
 2 xmin = 1; xmax = 7; % x limitation for pdf and cdf plot
 3 n= 100; % number of points for pdf and cdf plot
 4 k= 10000; % number of random draws for histogram
 5
 6 x= linspace( xmin , xmax , n );%create a set of values ranging from xmin to xmax
 7 p= exppdf( x , gamma ); % calculate the pdf
 8 c= expcdf( x , gamma); % calculate the cdf
 9
10 figure( 1 ); clf; % create a new figure and clear the contents
11 subplot( 1,3,1 );
12 plot(x,p);
13 xlabel( 'x' ); ylabel( 'pdf' );
14 title( 'Probability Density Function' );
15
16 subplot( 1,3,2 );
17 plot( x , c );
18 xlabel( 'x' ); ylabel( 'cdf' );
19 title( 'Cumulative Density Function' );
20
21 subplot( 1,3,3 );
22 %draw k random numbers from a N( mu , sigma ) distribution
23 %here the argument "1" means
24 y = exprnd( gamma, k , 1 );
25 hist( y , 20 );%20 bars
26 xlabel( 'x' ); ylabel( 'frequency' );
27 title( 'Histogram of random values' );
28
29 pause;
(2) Binomial
 1 N= 10; theta = 0.7; % parameters
 2 xmin = 0; xmax = 10; % x limitation for pdf and cdf plot
 3 n= 100; % number of points for pdf and cdf plot
 4 k= 10000; % number of random draws for histogram
 5
 6 x= linspace( xmin , xmax , n );%create a set of values ranging from xmin to xmax
 7 p= binopdf( x , N , theta ); % calculate the pdf
 8 c= binocdf( x , N , theta); % calculate the cdf
 9
10 figure( 1 ); clf; % create a new figure and clear the contents
11 subplot( 1,3,1 );
12 plot(x,p);
13 xlabel( 'x' ); ylabel( 'pdf' );
14 title( 'Probability Density Function' );
15
16 subplot( 1,3,2 );
17 plot( x , c );
18 xlabel( 'x' ); ylabel( 'cdf' );
19 title( 'Cumulative Density Function' );
20
21 subplot( 1,3,3 );
22 %draw k random numbers from a N( mu , sigma ) distribution
23 %here the argument "1" means
24 y = binornd( N , theta , k , 1 );
25 hist( y , 20 );%20 bars
26 xlabel( 'x' ); ylabel( 'frequency' );
27 title( 'Histogram of random values' );
28
29 pause;
(4) Uniform
 1 a= 5; b = 10; %parameters
 2 xmin = 4; xmax = 11; % x limitation for pdf and cdf plot
 3 n= 100; % number of points for pdf and cdf plot
 4 k= 10000; % number of random draws for histogram
 5
 6 x= linspace( xmin , xmax , n );%create a set of values ranging from xmin to xmax
 7 p= unifpdf( x , a , b ); % calculate the pdf
 8 c= unifcdf( x , a , b ); % calculate the cdf
 9
10 figure( 1 ); clf; % create a new figure and clear the contents
11 subplot( 1,3,1 );
12 plot(x,p);
13 xlabel( 'x' ); ylabel( 'pdf' );
14 title( 'Probability Density Function' );
15
16 subplot( 1,3,2 );
17 plot( x , c );
18 xlabel( 'x' ); ylabel( 'cdf' );
19 title( 'Cumulative Density Function' );
20
21 subplot( 1,3,3 );
22 %draw k random numbers from a N( mu , sigma ) distribution
23 %here the argument "1" means
24 y = unifrnd( a , b , k , 1 );
25 hist( y , 20 );%20 bars
26 xlabel( 'x' ); ylabel( 'frequency' );
27 title( 'Histogram of random values' );
28
29 pause;
(4) Generate identical replica
 1 a= 0; b = 1;
 2 n= 10;
 3 seed=1;
 4 rand('state',seed); randn('state',seed);
 5 unifrnd(a,b,n,1)
 6 %'state'是对随机发生器的状态进行初始化,并且定义该状态初始值。比如你过一段时间还要使用这个随机数的时候,还能保持当前的随机取值。
 7 %比如
 8 %randn('state',2013)
 9 %a = randn(1)
10 %b = randn(1) 会发现与上一个随机值不一样
11 %如果再定义一次
12 %randn('state',2013)
13 %c = randn(1) 会发现与a的值一样
14 rand('state',seed); randn('state',seed);
15 unifrnd(a,b,n,1)
(5) IQ Probalility
1 normcdf(130,100,15)-normcdf(110,100,15)