factorplot
用于绘制两维变量的关系图,也就是共用x坐标,按照hue分组,画出不同hue种类的y 的值,用kind可指定其作图类型,包括:point, bar, count, box, violin, strip等
目前还没有在官网找到对应的文档
但是记住:
参数kind:point默认,bar柱形图,count频次,box箱体,violin提琴,strip散点,swarm分散点
import seaborn as sns
tips = sns.load_dataset("tips")
sns.factorplot(x='day',y='total_bill',hue='smoker',data=tips)

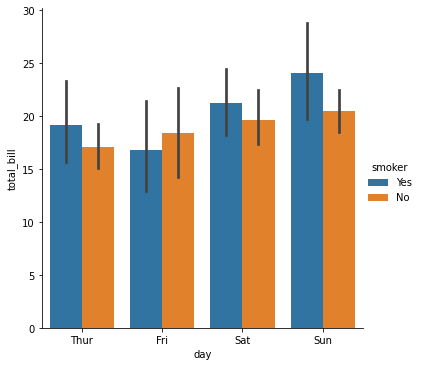
sns.factorplot(x='day',y='total_bill',hue='smoker',data=tips,kind='bar')
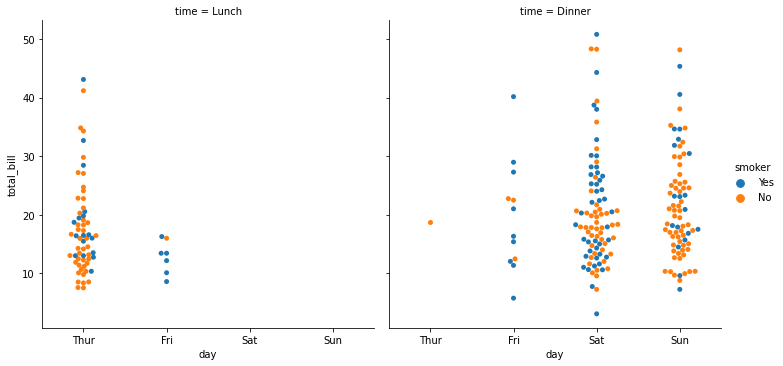
sns.factorplot(x='day',y='total_bill',hue='smoker',
               col='time',data=tips,kind='swarm')
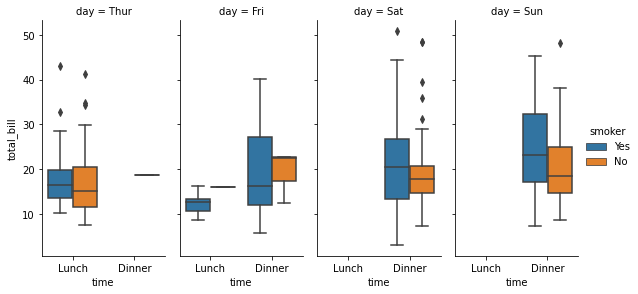
sns.factorplot(x='time',y='total_bill',hue='smoker',
               col='day',data=tips,kind='box',size=4,aspect=0.5)