先看看一个例子
#类别变量的每个类别频数可视化
def count_plot(x,  **kwargs):
    sns.countplot(x=x)
    x=plt.xticks(rotation=90)

f = pd.melt(train,  value_vars=['Sex','Embarked'])
g = sns.FacetGrid(f, col="variable",  col_wrap=2, sharex=False, sharey=False, size=5)
g = g.map(count_plot, "value")
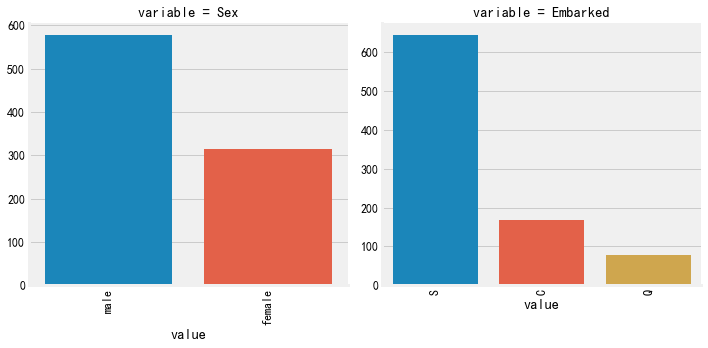
我的理解是绘制多个变量(但是数据量太多就不建议使用该方法,因为该类接受的对象是长数据,长数据需要使用到melt,数据量太大会很耗时),但是又不写循环时,可以使用sns.FacetGrid(),map里面可以使用你自已定义的函数,或者是sns、plt等
首先FacetGrid是seaborn库中的一个类,我们在初始化这个类时只需要给它传一个DataFrame的数据集即可。实例化这个类以后,我么就可以直接使用这个对象的方法绘制需要的图形
sns.FacetGrid(data, row=None, col=None, hue=None, col_wrap=None, sharex=True, sharey=True, height=3, aspect=1, palette=None, row_order=None,
col_order=None, hue_order=None, hue_kws=None, dropna=True, legend_out=True, despine=True, margin_titles=False, xlim=None, ylim=None, subplot_kws=None, gridspec_kws=None, size=None)
主要的参数
data:处理后的(“长格式”)dataframe数据
row, col, hue : strings 也就是行列,分组
col_wrap : int,画布可以分为多少列
看一些有哪些属性方法
pc.obj_info(sns.FacetGrid)
ObjInfo object of :
    函数/方法:['add_legend', 'despine', 'facet_axis', 'facet_data', 'map', 'map_dataframe', 'savefig', 'set', 'set_axis_labels', 'set_titles', 'set_xlabels', 'set_xticklabels', 'set_ylabels', 'set_yticklabels']

    属性:['ax']
我们主要看map,map接受画图方法(自定义或者sns自带等),接受需要画图的变量,可以有1个变量或者2个,2个就是x轴和y轴
想要看更详细的信息,请移步:https://blog.csdn.net/weixin_42398658/article/details/82960379