函数关系
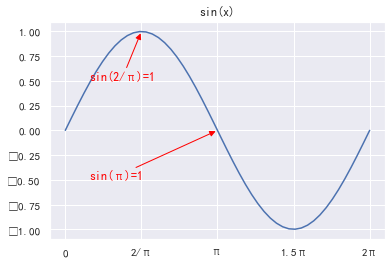
主要看看图形是怎么样的
#三角函数的自变量是角度
import matplotlib.pyplot as plt
import numpy as np
x = np.linspace(0, 2 * np.pi, 50)
y = np.sin(x)
plt.plot(x, y)
plt.title('sin(x)')
plt.xticks( (0, np.pi * 0.5, np.pi, np.pi * 1.5, np.pi * 2), ('0', '2/π', 'π', '1.5π', '2π') )
plt.annotate(s='sin(2/π)=1',xy=(np.pi * 0.5,1),xytext=(0.5,0.5),color='red',arrowprops=dict(arrowstyle='-|>',connectionstyle='arc3',color='red'))
plt.annotate(s='sin(π)=1',xy=(np.pi,0),xytext=(0.5,-0.5),color='red',arrowprops=dict(arrowstyle='-|>',connectionstyle='arc3',color='red'))
plt.show()
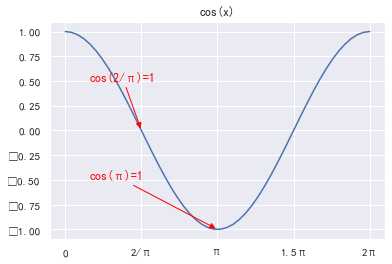
import matplotlib.pyplot as plt
import numpy as np
x = np.linspace(0, 2 * np.pi, 50)
y = np.cos(x)
plt.plot(x, y)
plt.title('cos(x)')
plt.xticks( (0, np.pi * 0.5, np.pi, np.pi * 1.5, np.pi * 2), ('0', '2/π', 'π', '1.5π', '2π') )
plt.annotate(s='cos(2/π)=1',xy=(np.pi * 0.5,0),xytext=(0.5,0.5),color='red',arrowprops=dict(arrowstyle='-|>',connectionstyle='arc3',color='red'))
plt.annotate(s='cos(π)=1',xy=(np.pi,-1),xytext=(0.5,-0.5),color='red',arrowprops=dict(arrowstyle='-|>',connectionstyle='arc3',color='red'))
plt.show()
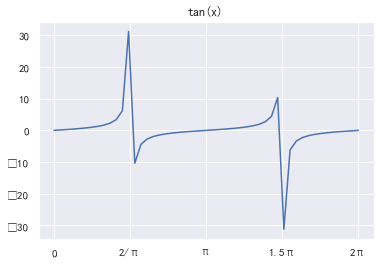
import matplotlib.pyplot as plt
import numpy as np
x = np.linspace(0, 2 * np.pi, 50)
y = np.sin(x)/np.cos(x)
plt.plot(x, y)
plt.title('tan(x)')
plt.xticks( (0, np.pi * 0.5, np.pi, np.pi * 1.5, np.pi * 2), ('0', '2/π', 'π', '1.5π', '2π') )
plt.show()
lnx是以e为底的对数函数,其中e是一个无du限不循环小数,其值约等于2.718281828459…
函数的图象是过点(1,0)的一条C型的曲线,串过第一,第四象限,且第四象限的曲线逐渐靠近Y
轴,但不相交,第一象限的曲线逐渐的远离X轴。
其定义域:x>0 值域:y(无穷);一般表示方法为lnx。数学中也常见以logx表示自然对数
import matplotlib.pyplot as plt
import numpy as np
x=np.arange(0.1,1000)
y=np.log(x)
plt.plot(x, y)
plt.title('lnx 或者是 logx')
plt.annotate(s='ln1=0',xy=(1,0),xytext=(0.5,0.5),color='red',arrowprops=dict(arrowstyle='-|>',connectionstyle='arc3',color='red'))
plt.show()

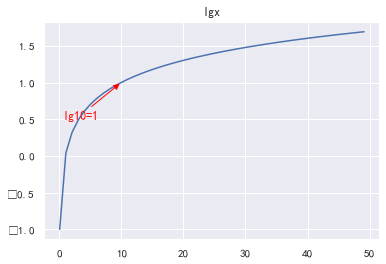
log10(x)又叫lg(x)是以10为底的对数
import matplotlib.pyplot as plt
import numpy as np
x=np.arange(0.1,50)
y=np.log10(x)
plt.plot(x, y)
plt.title('lgx')
plt.annotate(s='lg10=1',xy=(10,1),xytext=(0.5,0.5),color='red',arrowprops=dict(arrowstyle='-|>',connectionstyle='arc3',color='red'))
plt.show()