使用Echarts的一点总结
1.安装,我使用得vue
cnpm install echarts --save
2.在入口文件main.js中注册,并使用
// 引入折线图 echarts
import echarts from 'echarts'
Vue.prototype.$echarts = echarts
3.在需要使用折线图的模块使用
3.1 html部分,给定一个div
<div id="sleep" class="zonghe"></div>
3.2 js部分
 // 睡眠
    sleep() {
      // 基于准备好的dom,初始化echarts实例
      let sleep = this.$echarts.init(document.getElementById("sleep"));
      // 绘制图表
      sleep.setOption({
        tooltip: {},
        xAxis: {
          name: "日期",
          nameLocation: "end",
          nameTextStyle: {
            padding: -12
          },
          data: ["1", "2", "3", "4", "5"],
          type: "category",
          boundaryGap: false
        },
        color: ["#dcb7fe"],
        yAxis: {
          type: "value",
          name: "分数",
          nameLocation: "end",
          nameTextStyle: {
            padding: -8
          }
        },
        series: [
          {
            data: [54, 86, 36, 45, 75],
            type: "line"
          }
        ]
      });
    },
3.3 css部分
.zonghe {
  width: 6rem;
  height: 6rem;
  font-size: 0.15rem;
  color: rgb(179, 179, 179);
  margin-left: 0.46rem;
  margin-right: 0.46rem;
  margin-top: -0.6rem;
}
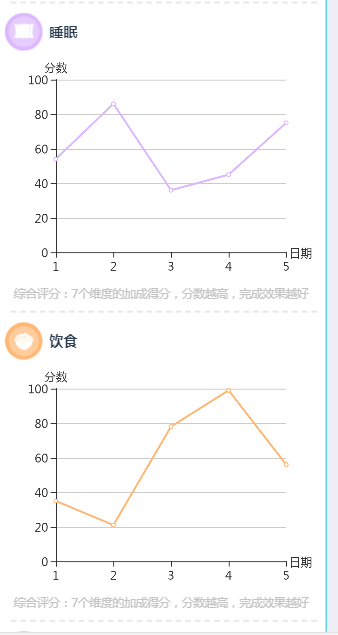
4.最后实现效果
