一、find命令
作用:查找文件
[root@server ~]# find / -name elasticsearch
/var/log/elasticsearch
/var/run/elasticsearch
/var/lock/subsys/elasticsearch
/var/lib/elasticsearch
/var/lib/elasticsearch/elasticsearch
/usr/share/elasticsearch
/usr/share/elasticsearch/bin/elasticsearch
/etc/rc.d/init.d/elasticsearch
/etc/elasticsearch
/etc/sysconfig/elasticsearch
/opt/kibana/src/plugins/elasticsearch
/opt/kibana/node_modules/elasticsearch
二、tar 打包压缩与解压命令
[root@template ~]# cd /tmp

#进入目录打包文件
[root@template tmp]# tar czvf passwd.tar.gz passwd
passwd

#指定解压目录
[root@template tmp]# tar xzvf passwd.tar.gz -C /tmp
passwd

[root@template tmp]# ll
total 8
-rw-r--r--. 1 root root 1138 Apr 16 04:12 passwd
-rw-r--r--. 1 root root  618 Apr 16 04:13 passwd.tar.gz
用脚本对文件进行打包
[root@template tmp]# ll
总用量 8
drwxr-xr-x 2 root root 4096 4月 28 18:07 nulige
-rw-r--r-- 1 root root 75 4月 28 18:24 tar_backup.sh
[root@template tmp]# sh tar_backup.sh
ok
[root@template tmp]# ll
总用量 12
drwxr-xr-x 2 root root 4096 4月 28 18:07 nulige
-rw-r--r-- 1 root root 190 4月 28 18:24 nulige.tar.gz
-rw-r--r-- 1 root root 75 4月 28 18:24 tar_backup.sh
[root@template tmp]# cat tar_backup.sh
#!/bin/sbin
cd /tmp
tar zcf nulige.tar.gz ./nulige
[ $? -eq 0 ] && echo ok
三、grep命令
示例:过滤出带有/sbin/nologin的内容
[root@template tmp]# grep /sbin/nologin /etc/passwd
bin:x:1:1:bin:/bin:/sbin/nologin
daemon:x:2:2:daemon:/sbin:/sbin/nologin
adm:x:3:4:adm:/var/adm:/sbin/nologin
lp:x:4:7:lp:/var/spool/lpd:/sbin/nologin
mail:x:8:12:mail:/var/spool/mail:/sbin/nologin
operator:x:11:0:operator:/root:/sbin/nologin
games:x:12:100:games:/usr/games:/sbin/nologin
ftp:x:14:50:FTP User:/var/ftp:/sbin/nologin
nobody:x:99:99:Nobody:/:/sbin/nologin
avahi-autoipd:x:170:170:Avahi IPv4LL Stack:/var/lib/avahi-autoipd:/sbin/nologin
systemd-bus-proxy:x:999:997:systemd Bus Proxy:/:/sbin/nologin
systemd-network:x:998:996:systemd Network Management:/:/sbin/nologin
dbus:x:81:81:System message bus:/:/sbin/nologin
polkitd:x:997:995:User for polkitd:/:/sbin/nologin
abrt:x:173:173::/etc/abrt:/sbin/nologin
tss:x:59:59:Account used by the trousers package to sandbox the tcsd daemon:/dev/null:/sbin/nologin
postfix:x:89:89::/var/spool/postfix:/sbin/nologin
sshd:x:74:74:Privilege-separated SSH:/var/empty/sshd:/sbin/nologin
mysql:x:27:27:MariaDB Server:/var/lib/mysql:/sbin/nologin
四、stat命令
作用:用于查看文件的具体存储信息和时间
[root@template tmp]# stat passwd
File: ‘passwd’
Size: 1138 Blocks: 8 IO Block: 4096 regular file
Device: fd00h/64768d Inode: 102426465 Links: 1
Access: (0644/-rw-r--r--) Uid: ( 0/ root) Gid: ( 0/ root)
Context: unconfined_u:object_r:user_tmp_t:s0
Access: 2017-04-16 04:14:47.442943634 +0800
Modify: 2017-04-16 04:12:48.000000000 +0800
Change: 2017-04-16 04:14:47.442943634 +0800
Birth: -
五、cut命令
作用:用来按列提取文本字条
参数:
-f 参数:用来设置要看的列数
-d参数:设置间隔符号
示例:提取出passwd文件中的用户名
[root@template tmp]# cut -d: -f1 /etc/passwd
root
bin
daemon
adm
lp
sync
shutdown
halt
mail
operator
games
ftp
nobody
avahi-autoipd
systemd-bus-proxy
systemd-network
dbus
polkitd
abrt
tss
postfix
sshd
mysql
六、head命令
作用:用来查看文本文档
示例:显示前10行
[root@template tmp]# head -n 10 /etc/passwd
root:x:0:0:root:/root:/bin/bash
bin:x:1:1:bin:/bin:/sbin/nologin
daemon:x:2:2:daemon:/sbin:/sbin/nologin
adm:x:3:4:adm:/var/adm:/sbin/nologin
lp:x:4:7:lp:/var/spool/lpd:/sbin/nologin
sync:x:5:0:sync:/sbin:/bin/sync
shutdown:x:6:0:shutdown:/sbin:/sbin/shutdown
halt:x:7:0:halt:/sbin:/sbin/halt
mail:x:8:12:mail:/var/spool/mail:/sbin/nologin
operator:x:11:0:operator:/root:/sbin/nologin
七、history
作用:查看历史记录命令
[root@template tmp]# history
    1  ip a
    2  shutdown -h now
    3  ip addr
    4  systemctl restart network
    5  ip addr
清空历史记录
[root@template tmp]# history -c
八、sosreport
sosreport命令用于收集系统配置并诊断信息后输出结论文档,格式为:“sosreport”。
当咱们的Linux系统出现故障需要联系红帽厂商或其他技术支持时,大多数时候都要先使用这个SOS功能来简单收集计算机的状态和配置信息,以便让技术支持公司能够通过远程就解决了一些小问题,又或者让他们能对复杂问题能提前有些了解:
[root@template tmp]# sosreport

sosreport (version 3.2)

This command will collect diagnostic and configuration information from
this CentOS Linux system and installed applications.

An archive containing the collected information will be generated in
/var/tmp and may be provided to a CentOS support representative.

Any information provided to CentOS will be treated in accordance with
the published support policies at:

  https://www.centos.org/

The generated archive may contain data considered sensitive and its
content should be reviewed by the originating organization before being
passed to any third party.

No changes will be made to system configuration.

Press ENTER to continue, or CTRL-C to quit.  #此处敲击回车来确认收集信息

Please enter your first initial and last name [template]:    #此处敲击回车,来确认主机名称
Please enter the case id that you are generating this report for []:  #此处敲击回车,生成报告

 Setting up archive ...
 Setting up plugins ...
 Running plugins. Please wait ...

  Running 77/77: yum...
Creating compressed archive...


Your sosreport has been generated and saved in:
  /var/tmp/sosreport-template-20170416043251.tar.xz

The checksum is: 9f5d08f6373e35985213ab8001f7a078

Please send this file to your support representative.

#此压缩包文件和这段校验值就是要发送给对方的内容。

#查看生成的报告
[root@template tmp]# ll /var/tmp/
-rw-------. 1 root root 5543652 Apr 16 04:34 sosreport-template-20170416043251.tar.xz
九、free命令
作用:显示当前系统中内存的使用量信息
[root@linux~]# free -h
| 总计内存量 | 已用量 | 可用量 | 进程共享的内存量 | 磁盘缓存的内存量 | 缓存的内存量 | |
| total | used | free | shared | buffers | cached | |
| Mem: | 1.8G | 1.3G | 542M | 9.8M | 1.6M | 413M |
| -/+ buffers/cache: | 869M | 957M | ||||
| Swap: | 2.0G | 0B | 2.0G |
十、w和who命令
作用:查看当前登入主机的用户信息
[root@template tmp]# w
 04:40:12 up  1:04,  2 users,  load average: 0.00, 0.12, 0.12
USER     TTY      FROM             LOGIN@   IDLE   JCPU   PCPU WHAT
root     tty1                      03:36   55:00   0.15s  0.15s -bash
root     pts/0    192.168.30.1     03:46    4.00s  0.67s  0.02s w
[root@template tmp]# who
root     tty1         2017-04-16 03:36
root     pts/0        2017-04-16 03:46 (192.168.30.1)
十一、uptime命令
作用:用于查看系统的负载信息,
格式为:“uptime”。

这个命令真的很棒,它可以为您显示当前系统时间、系统已运行时间、当前在线用户以及平均负载值等信息数据。平均负载值指的是最近1分钟、5分钟、15分钟的系统压力情况,负载值越低越好,尽量不要长期超过1。另外您还可以结合搭配用"watch -n 1 uptime"命令来每秒刷新一次来获得当前的系统负载情况。

[root@linux~]# uptime
22:49:55 up 10 min, 2 users, load average: 0.01, 0.19, 0.18
十二、查看系统详细版本和内核版本
[root@template tmp]# uname -a
Linux template 3.10.0-327.el7.x86_64 #1 SMP Thu Nov 19 22:10:57 UTC 2015 x86_64 x86_64 x86_64 GNU/Linux

[root@template tmp]# cat /etc/redhat-release
CentOS Linux release 7.2.1511 (Core)
十三、pidof命令
作用:查看指定服务的进程pid值
[root@template tmp]# pidof sshd
2956 1538
十四、top命令
作用:用于动态的监视进程活动与系统负载等信息
功能类似于windows系统中的任务管理器
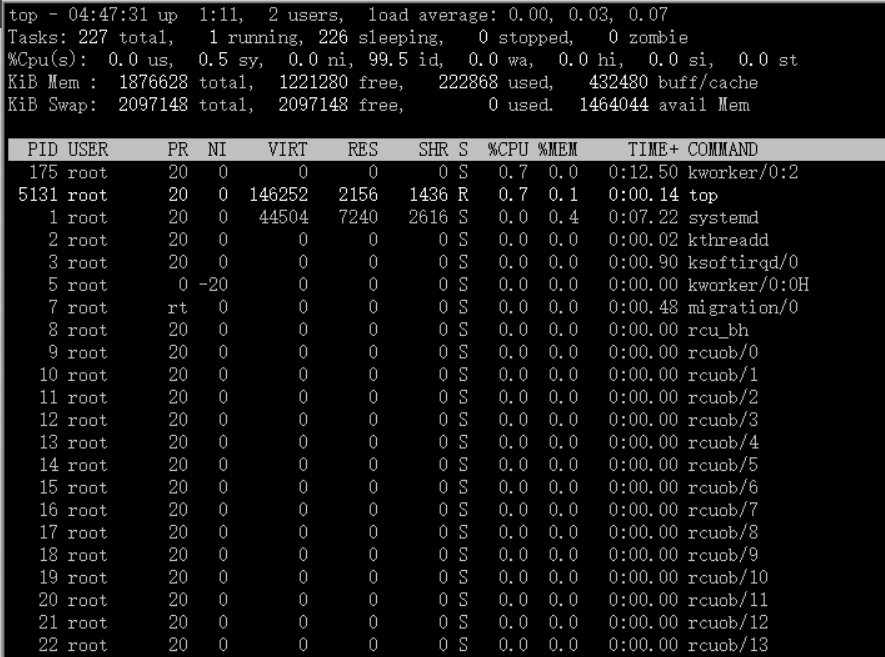
前面的五行为系统整体的统计信息,下面咱们来逐行的讲解:
第1行:系统时间,运行时间,登录用户数,系统负载(分别为1分钟、5分钟、15分钟的平均值)。第2行:进程总数,运行中的,睡眠中的,停止的,僵死的。第3行:用户占用资源,系统内核占用资源,改变过优先级的进程,空闲的资源,等待输入输出的时间。此行数据均为CPU数据并以百分比格式显示,例如"99.2 id"意味着有99.2%的CPU资源正在空闲中。第4行:物理内存总量,使用量,空闲量,作为内核缓存的内存量。第5行:虚拟内存总量,使用量,空闲量,已被提前加载的内存数据。
十五、ps命令
作用:用于查看系统中的进程状态
| 参数 | 作用 |
| -a | 显示所有的进程(包括其他用户的) |
| -u | 用户以及其他详细信息 |
| -x | 显示没有控制终端的进程 |
Linux系统中时刻运行着许许多多的进程,如果能够合理的管理它们,绝对有益于系统的性能优化,Linux系统中进程最常见的5种不同的状态是运行、中断、不可中断、僵死与停止,它们的特性分别是:
R(运行):正在运行或在运行队列中等待。S(中断):休眠中, 在等待某个条件的形成或接收到信号。D(不可中断):收到信号不唤醒和不可运行, 进程必须等待直到有中断发生。Z:(僵死):进程已终止, 但进程描述符存在, 直到父进程调用wait4()系统调用后释放。T:(停止):进程收到SIGSTOP, SIGSTP, SIGTIN, SIGTOU信号后停止运行。
当执行"ps aux"命令后通常会看到下面格式的进程状态,表格中只是列举了部分输出值,而且正常的输出值中不包括中文注释部分:
| USER | PID | %CPU | %MEM | VSZ | RSS | TTY | STAT | START | TIME | COMMAND |
| 进程的所有者 | 进程ID号 | 运算器占用率 | 内存占用率 | 虚拟内存使用量(单位是KB) | 占用的固定内存量(单位是KB) | 所在终端 | 进程状态 | 被启动的时间 | 实际使用CPU的时间 | 命令名称与参数 |
| root | 1 | 0.0 | 0.4 | 53684 | 7628 | ? | Ss | 07:22 | 0:02 | /usr/lib/systemd/systemd |
| root | 2 | 0.0 | 0.0 | 0 | 0 | ? | S | 07:22 | 0:00 | [kthreadd] |
| root | 3 | 0.0 | 0.0 | 0 | 0 | ? | S | 07:22 | 0:00 | [ksoftirqd/0] |
| root | 5 | 0.0 | 0.0 | 0 | 0 | ? | S< | 07:22 | 0:00 | [kworker/0:0H] |
| root | 7 | 0.0 | 0.0 | 0 | 0 | ? | S | 07:22 | 0:00 | [migration/0] |
十六、date命令
date命令用于显示及设置系统的时间或日期,格式为:"date [选项] [+指定的格式]"。
强大的date命令只需键入以"+"号开头的参数即可按照指定格式来输出系统的时间或日期,这样日常工作时咱们便可以将打包数据的备份命令与指定格式输出的时间信息结合到一起,使得咱们可以更加便捷的区分每个文件的备份时间啦,date命令常见的格式如下:
| 参数 | 作用 |
| %t | 跳格[TAB键] |
| %H | 小时(00-23) |
| %I | 小时(00-12) |
| %M | 分钟(00-59) |
| %S | 秒(00-59) |
| %X | 相当于%H:%M:%S |
| %Z | 显示时区 |
| %p | 显示本地AM或PM |
| %A | 星期几 (Sunday-Saturday) |
| %a | 星期几 (Sun-Sat) |
| %B | 完整月份 (January-December) |
| %b | 缩写月份 (Jan-Dec) |
| %d | 日(01-31) |
| %j | 一年中的第几天(001-366) |
| %m | 月份(01-12) |
| %Y | 完整的年份 |
按照默认的格式查看当前的系统时间:
[root@linux ~]# date
Mon Aug 24 16:11:23 CST 2016
按照"年-月-日 小时:分钟:秒"的格式查看当前的系统时间:
[root@linux ~]# date "+%Y-%m-%d %H:%M:%S"
2016-08-24 16:29:12
设置当前的系统时间为2016年9月1日8点30分:
[root@linux ~]# date -s "20160901 8:30:00"
Tue Sep 1 08:30:00 CST 2016
再次按照默认的格式查看当前的系统时间:
[root@linux ~]# date
Tue Sep 1 08:30:01 CST 2016
查看今天是一年中的第几天:
[root@linux ~]# date "+%j"
245
十七、dd命令
作用:用于指定大小的拷贝文件或指定转换文件
dd命令:是个比较重要且具有特色的一个命令,它能够让用户指定数据块的大小和个数来复制一个文件的内容,当然如果您愿意的话还可以在复制过程中转换其中的数据。Linux系统中有一个叫做/dev/zero的设备文件,每次讲课解释起来都感觉有点哲学理论的色彩,因为它不会占用您的系统存储空间,但里面却可以保存有无穷无尽的数据,一般用来搭配dd命令来生成出来一个指定大小的文件是再好不过的了。
| 参数 | 作用 |
| if | 输入的文件名称。 |
| of | 输出的文件名称。 |
| bs | 设置每个“块”的大小。 |
| count | 设置要拷贝“块”的个数。 |
[root@linux ~]# dd if=/dev/zero of=560_file count=1 bs=560M
1+0 records in
1+0 records out
587202560 bytes (587 MB) copied, 27.1755 s, 21.6 MB/s
#从光驱中复制iso镜像文件到服务器指定目录(注意:光驱插入Centos7.2.iso文件)
#从/dev/cdrom 中复制镜像文件到/opt目录中

[root@template opt]# dd if=/dev/cdrom of=/opt/CentOS-7.2.iso
记录了8456192+0 的读入
记录了8456192+0 的写出
4329570304字节(4.3 GB)已复制,155.866 秒,27.8 MB/秒
十八、生产常用命令
1.删除0字节文件
find -type f -size 0 -exec rm -rf {} ;
2.查看进程
按内存从大到小排列
ps -e -o “%C : %p : %z : %a”|sort -k5 -nr
3.按cpu利用率从大到小排列
ps -e -o “%C : %p : %z : %a”|sort -nr
4.打印说cache里的URL
grep -r -a jpg /data/cache/* | strings | grep “http:” | awk -F’http:’ ‘{print “http:”$2;}’
5.查看http的并发请求数及其TCP连接状态:
netstat -n | awk ‘/^tcp/ {++S[$NF]} END {for(a in S) print a, S[a]}’
6.
sed -i ‘/Root/s/no/yes/’ /etc/ssh/sshd_config sed在这个文里Root的一行,匹配Root一行,将no替换成yes.
7.1.如何杀掉mysql进程:
ps aux|grep mysql|grep -v grep|awk ‘{print $2}’|xargs kill -9
(从中了解到awk的用途)
pgrep mysql |xargs kill -9
killall -TERM mysqld
kill -9 `cat /usr/local/apache2/logs/httpd.pid`
试试查杀进程PID
8.显示运行3级别开启的服务:
ls /etc/rc3.d/S* |cut -c 15-
(从中了解到cut的用途,截取数据)
9.如何在编写SHELL显示多个信息,用EOF
cat << EOF +--------------------------------------------------------------+ | === Welcome to Tunoff services === | +--------------------------------------------------------------+ EOF
10. for 的巧用(如给mysql建软链接)
cd /usr/local/mysql/bin for i in * do ln /usr/local/mysql/bin/$i /usr/bin/$i done
11. 取IP地址:
ifconfig eth0|sed -n '2p'|awk '{print $2}'|cut -c 6-30 或者: ifconfig eth0 |grep "inet addr:" |awk '{print $2}'|cut -c 6- 或者 ifconfig | grep 'inet addr:'| grep -v '127.0.0.1' | cut -d: -f2 | awk '{ print $1}' 或者: ifconfig eth0 | sed -n '/inet /{s/.*addr://;s/ .*//;p}'
Perl实现获取IP的方法:
ifconfig -a | perl -ne 'if ( m/^s*inet (?:addr:)?([d.]+).*?cast/ ) { print qq($1
); exit 0; }'
12.内存的大小: free -m |grep "Mem" | awk '{print $2}'
13. netstat -an -t | grep ":80" | grep ESTABLISHED | awk '{printf "%s %s
",$5,$6}' | sort
14.查看Apache的并发请求数及其TCP连接状态: netstat -n | awk '/^tcp/ {++S[$NF]} END {for(a in S) print a, S[a]}'
15.因为同事要统计一下服务器下面所有的jpg的文件的大小,写了个shell给他来统计.原来用xargs实现,但他一次处理一部分,搞的有多个总和....,下面的命令就能解决啦.
find / -name *.jpg -exec wc -c {} ;|awk '{print $1}'|awk '{a+=$1}END{print a}'
CPU的数量(多核算多个CPU, cat /proc/cpuinfo |grep -c processor )越多,系统负载越低,每秒能处理的请求数也越多。
--------------------------------------------------------------------------------------------------------------------
16. CPU负载 # cat /proc/loadavg 检查前三个输出值是否超过了系统逻辑CPU的4倍。
18. CPU负载 #mpstat 1 1 检查%idle是否过低(比如小于5%)
19. 内存空间 # free 检查free值是否过低 也可以用 # cat /proc/meminfo
20. swap空间 # free 检查swap used值是否过高 如果swap used值过高,进一步检查swap动作是否频繁: # vmstat 1 5 观察si和so值是否较大
21. 磁盘空间 # df -h 检查是否有分区使用率(Use%)过高(比如超过90%) 如发现某个分区空间接近用尽,可以进入该分区的挂载点,用以下命令找出占用空间最多的文件或目录: # du -cks * | sort -rn | head -n 10
22. 磁盘I/O负载 # iostat -x 1 2 检查I/O使用率(%util)是否超过100%
23. 网络负载 # sar -n DEV 检查网络流量(rxbyt/s, txbyt/s)是否过高
24. 网络错误 # netstat -i 检查是否有网络错误(drop fifo colls carrier) 也可以用命令:# cat /proc/net/dev
25. 网络连接数目 # netstat -an | grep -E “^(tcp)” | cut -c 68- | sort | uniq -c | sort -n
26. 进程总数 # ps aux | wc -l 检查进程个数是否正常 (比如超过250)
27. 可运行进程数目 # vmwtat 1 5 列给出的是可运行进程的数目,检查其是否超过系统逻辑CPU的4倍
28. 进程 # top -id 1 观察是否有异常进程出现
29. 网络状态 检查DNS, 网关等是否可以正常连通
ping traceroute nslookup dig
30. 用户 # who | wc -l 检查登录用户是否过多 (比如超过50个) 也可以用命令:# uptime
31. 系统日志 # cat /var/log/rflogview/*errors
检查是否有异常错误记录 也可以搜寻一些异常关键字,例如:
# grep -i error /var/log/messages # grep -i fail /var/log/messages
# egrep -i 'error|warn' /var/log/messages 查看系统异常 32 核心日志
# dmesg 检查是否有异常错误记录
33. 系统时间 # date 检查系统时间是否正确
当前时间: date +"%Y-%m-%d %H:%M:%S"
34. 打开文件数目 # lsof | wc -l 检查打开文件总数是否过多
35. 日志 # logwatch ?print 配置/etc/log.d/logwatch.conf,将 Mailto 设置为自己的email 地址,启动mail服务 (sendmail或者postfix),这样就可以每天收到日志报告了。
缺省logwatch只报告昨天的日志,可以用# logwatch ?print ?range all 获得所有的日志分析结果。
可以用# logwatch ?print ?detail high 获得更具体的日志分析结果(而不仅仅是出错日志)。
36.杀掉80端口相关的进程 lsof -i :80|grep -v "PID"|awk '{print "kill -9",$2}'|sh
37.清除僵死进程。 ps -eal | awk '{ if ($2 == "Z") {print $4}}' | kill -9
38.tcpdump 抓包 ,用来防止80端口被人攻击时可以分析数据
# tcpdump -c 10000 -i eth0 -n dst port 80 > /root/pkts
39.然后检查IP的重复数 并从小到大排序 注意 “-t +0″ 中间是两个空格
# less pkts | awk {'printf $3"
"'} | cut -d. -f 1-4 | sort | uniq -c | awk {'printf $1" "$2"
"'} | sort -n -t +0
40.查看有多少个活动的php-cgi进程
netstat -anp | grep php-cgi | grep ^tcp | wc -l
41.利用iptables对应简单攻击
netstat -an | grep -v LISTEN | awk ‘{print $5}’ |grep -v 127.0.0.1|grep -v 本机ip|sed “s/::ffff://g”|awk ‘BEGIN { FS=”:” } { Num[$1]++ } END { for(i in Num) if(Num>8) { print i} }’ |grep ‘[0-9]{1,3}.[0-9]{1,3}.[0-9]{1,3}.[0-9]{1,3}’| xargs -i[] iptables -I INPUT -s [] -j DROP
Num>8部分设定值为阀值,这条句子会自动将netstat -an 中查到的来自同一IP的超过一定量的连接的列入禁止范围。 基中本机ip改成你的服务器的ip地址
42. 怎样知道某个进程在哪个CPU上运行?
# ps -eo pid,args,psr
43. 查看硬件制造商
dmidecode -s system-product-name
44.perl如何编译成字节码,这样在处理复杂项目的时候会更快一点?
perlcc -B -o webseek webseek.pl
45. 统计var目录下文件以M为大小,以列表形式列出来。
find /var -type f | xargs ls -s | sort -rn | awk ‘{size=$1/1024; printf(“%dMb %s
”, size,$2);}’ | head
查找var目录下文件大于100M的文件,并统计文件的个数
find /var -size +100M -type f | tee file_list | wc -l
46. sed 查找并替换内容
sed -i “s/varnish/LTCache/g” `grep “Via” -rl /usr/local/src/varnish-2.0.4`
sed -i “s/X-Varnish/X-LTCache/g” `grep “X-Varnish” -rl /usr/local/src/varnish-2.0.4`
47. 查看服务器制造商
dmidecode -s system-product-name
48. wget 模拟user-agent抓取网页
wget -m -e robots=off -U “Mozilla/5.0 (Windows; U; Windows NT 5.1; zh-CN; rv:1.9.1.6) Gecko/20091201 Firefox/3.5.6” http://www.example.com/
50. 统计目录下文件的大小(按M打印显示)
du $1 –max-depth=1 | sort -n|awk ‘{printf “%7.2fM —-> %s
”,$1/1024,$2}’|sed ‘s:/.*/([^/]{1,})$:1:g’
51.关于CND实施几个相关的统计
统计一个目录中的目录个数
ls -l | awk ‘/^d/’ | wc -l
统计一个目录中的文件个数
ls -l | awk ‘/^-/’ | wc -l
统计一个目录中的全部文件数
find ./ -type f -print | wc -l
统计一个目录中的全部子目录数
find ./ -type d -print | wc -l
统计某类文件的大小:
find ./ -name “*.jpg” -exec wc -c {} ;|awk ‘{print $1}’|awk ‘{a+=$1}END{print a}’
53. 查找占用磁盘IO最多的进程
wget -c http://linux.web.psi.ch/dist/scientific/5/gfa/all/dstat-0.6.7-1.rf.noarch.rpm
dstat -M topio -d -M topbio
54. 去掉第一列(如行号代码)
awk ‘{for(i=2;i<=NF;i++) if(i!=NF){printf $i" "}else{print $i} }' list
55.输出256中色彩
for i in {0..255}; do echo -e "e[38;05;${i}m${i}"; done | column -c 80 -s ' '; echo -e "e[m"
56.查看机器支持内存 机器插内存情况: dmidecode |grep -P "Maximums+Capacity"
机器最大支持内存: dmidecode |grep -P "Maximums+Capacity"
57.查看PHP-CGI占用的内存总数:
total=0; for i in `ps -C php-cgi -o rss=`; do total=$(($total+$i)); done; echo "PHP-CGI Memory usage: $total kb"
1、find用法
[root@template tmp]# find / -type f -name "text.txt"
/tmp/text.txt
/root/text.txt

#找到文件后,交给管道删除
[root@template tmp]# find / -type f -name "text.txt" | xargs rm -f
面试题:删除一个目录下的所有文件,但保留一个指定文件(保留file10)
[root@template tmp]# touch file{1..10}
[root@template tmp]# ll
总用量 0
-rw-r--r-- 1 root root 0 5月  20 10:15 file1
-rw-r--r-- 1 root root 0 5月  20 10:11 file10
-rw-r--r-- 1 root root 0 5月  20 10:15 file2
-rw-r--r-- 1 root root 0 5月  20 10:15 file3
-rw-r--r-- 1 root root 0 5月  20 10:15 file4
-rw-r--r-- 1 root root 0 5月  20 10:15 file5
-rw-r--r-- 1 root root 0 5月  20 10:15 file6
-rw-r--r-- 1 root root 0 5月  20 10:15 file7
-rw-r--r-- 1 root root 0 5月  20 10:15 file8
-rw-r--r-- 1 root root 0 5月  20 10:15 file9


#方法一:
[root@template tmp]# find /tmp -type f ! -name "file10"|xargs rm -f

方法二:
[root@template tmp]# find /tmp -type f ! -name "file10" -exec rm -f {} ;

#find找到的内容,-exec是参数,{}:要查找的目标,一般可以不写   :反斜杠转义字符
!作用就是:取反
2、rm remove 删除文件或者目录
-f 强制
-r 删除目录
注意:生产场景尽量不要使用rm,如果非要用,一定要先cp备份
[root@template tmp]# ll
总用量 0
-rw-r--r-- 1 root root 0 5月  20 10:06 text.txt
[root@template tmp]# rm -f text.txt
[root@template tmp]# ll
总用量 0
3、echo用法
打印输出内容,配合“>或>>” 可以为文件覆盖及追加内容
">" 意思是重定向,会清除文件里所有以前数据
">>" 为追加内容
4、cat 查看文件内容
特殊用法:增加多行内容
[root@template tmp]# cat >>/tmp/nulige.txt <<EOF
> I am studying linux.
> EOF
[root@template tmp]# ll
总用量 4
-rw-r--r-- 1 root root  0 5月  20 10:11 file10
-rw-r--r-- 1 root root 21 5月  20 10:33 nulige.txt
[root@template tmp]# cat nulige.txt
I am studying linux.
cat高级用法示例:
1、过滤出除liya的字母

[root@template tmp]# cat text.txt
test
limen
liya

方法一:
[root@template tmp]# cat text.txt|grep -v "liya" text.txt
test
limen

方法二:
[root@template tmp]# head -2 text.txt
test
limen
6、sed命令
作用:过滤:sed -n '/过滤的内容/处理的命令' 文件
-n 取消sed 的默认输出
-p print打印
-d delete删除
-i 改变文件内容
1、过滤出除liya的字母

[root@template tmp]# cat text.txt
test
limen
liya
方法一:
[root@template tmp]# grep -v "liya" text.txt
test
limen

方法二:
[root@template tmp]# sed -e /^tmp/d text.txt
test
limen
liya

方法三:
[root@template tmp]# sed -e /^liya/d text.txt
test
limen

方法四:
[root@template tmp]# sed /liya/d text.txt
test
limen
5、cp 命令
语法:
cp 源文件 目录文件(cp 的得要参数apr)
参数:
-a :相当于-pdr
-d :若源文件为链接文件(link file),则复制链接文件属性而非档案本身
-f :强制,右目录档案已经存在且无法开启,则移除后再尝试
-i: 若目标文件已经存在时,覆盖时会先询问
-p:连同档案的属性一起复制过去,而非使用默认属性
-r:递归,用于复制目录
-u:若目标文件存在,则目标文件比源文件旧时才复制
提示:如果源文件是多个,那么目标文件在最后,且是目录
6、date----显示、修改系统时间
date [options][+format][date]
$ date -s 06/09/2004 修改日期(按月日年格式)
$ date -s 13:56:00 修改时间(按时分秒格式)
$ date -r test 显示test文件最后一次的修改时间
$ date +'%Y-%m-%d' 以yyyy-mm-dd格式显示日期,其它格式请参考帮助
$ clock -r 查询BIOS时间
$ clock -w 把修改后的时间写回BIOS