1.直接上代码:
option = { backgroundColor: '#f7f7f7',//背景颜色 tooltip : { show: true, formatter: "{a} <br/>{b} : {c} ({d}%)" }, title: [ { text: 'Other占比饼状图', top: '4%', left:'39%', textStyle:{ color:'#d1ecff', fontStyle:'normal', fontWeight:'600', fontFamily:'sans-serif', fontSize:25 } }, { text: '不同楼层房屋占比饼状图', top: '15%', left:'8%', textStyle:{ color:'#d1ecff', fontStyle:'normal', fontWeight:'600', fontFamily:'sans-serif', fontSize:18 } },{ text: "不同户型房屋占比饼状图", top:'15%', left:'39%', textStyle:{ color:'#ccc', fontStyle:'normal', fontWeight:'600', fontFamily:'sans-serif', fontSize:18 } }, { text: "不同房屋朝向占比饼状图", top: '15%', left: '69%', textStyle:{ color:'#ccc', fontStyle:'normal', fontWeight:'600', fontFamily:'sans-serif', fontSize:18 } }, { text: '不同装修房屋占比饼状图', top: '55%', left:'8%', textStyle:{ color:'#d1ecff', fontStyle:'normal', fontWeight:'600', fontFamily:'sans-serif', fontSize:18 } },{ text: "房屋有无电梯占比饼状图", top:'55%', left:'39%', textStyle:{ color:'#ccc', fontStyle:'normal', fontWeight:'600', fontFamily:'sans-serif', fontSize:18 } }, { text: "不同房屋类型占比饼状图", top: '55%', left: '69%', textStyle:{ color:'#ccc', fontStyle:'normal', fontWeight:'600', fontFamily:'sans-serif', fontSize:18 } }], toolbox: { show : false, feature : { mark : {show: true}, dataView : {show: true, readOnly: false}, restore : {show: true}, saveAsImage : {show: true} } }, calculable:false, series : [ { name:'报警数占比', type:'pie', center: ['20%', '35%'], radius: [0, '25%'], data:[{name:'a0',value:114}, {name:'b0',value:100}, {name:'c0',value:240}], itemStyle: {//系列级个性化 normal: { color: function(params) { var colorList = [ '#339CD1','#FE8463','#9BCA63','#FAD860', '#9CD2ED','#F8AB96','#80BF35','#F3C72C','#C1232B' ]; return colorList[params.dataIndex] }, labelLine:{//饼图不显示线条 length:2, show:false }, label:{//饼图不显示文字 show:true, position : 'inner',//饼图图上显示百分比 formatter : function (params) { return (params.percent - 0).toFixed(0) + '%' }, textStyle:{ fontSize:14 } }, } } }, { name:'掉线数占比', type:'pie', center: ['50%', '35%'], radius: [0, '25%'], data:[{name:'a1',value:45}, {name:'b1',value:54}, {name:'c1',value:23}], itemStyle: {//系列级个性化 normal: { color: function(params) { var colorList = [ '#339CD1','#FE8463','#9BCA63','#FAD860', '#9CD2ED','#F8AB96','#80BF35','#F3C72C','#C1232B' ]; return colorList[params.dataIndex] }, labelLine:{//饼图不显示线条 length:2, show:false }, label:{//饼图不显示文字 show:true, position : 'inner',//饼图图上显示百分比 formatter : function (params) { return (params.percent - 0).toFixed(0) + '%' }, textStyle:{ fontSize:14 } } } } }, { name:'掉线数占比', type:'pie', center: ['80%', '35%'], radius: [0, '25%'], data:[{name:'a2',value:76}, {name:'b2',value:56}, {name:'c2',value:97}], itemStyle: {//系列级个性化 normal: { color: function(params) { var colorList = [ '#339CD1','#FE8463','#9BCA63','#FAD860', '#9CD2ED','#F8AB96','#80BF35','#F3C72C','#C1232B' ]; return colorList[params.dataIndex] }, labelLine:{//饼图不显示线条 length:2, show:false }, label:{//饼图不显示文字 show:true, position : 'inner',//饼图图上显示百分比 formatter : function (params) { return (params.percent - 0).toFixed(0) + '%' }, textStyle:{ fontSize:14 } } } } }, { name:'掉线数占比', type:'pie', center: ['20%', '75%'], radius: [0, '25%'], data:[{name:'a3',value:34}, {name:'b3',value:40}, {name:'c3',value:40}], itemStyle: {//系列级个性化 normal: { color: function(params) { var colorList = [ '#339CD1','#FE8463','#9BCA63','#FAD860', '#9CD2ED','#F8AB96','#80BF35','#F3C72C','#C1232B' ]; return colorList[params.dataIndex] }, labelLine:{//饼图不显示线条 length:2, show:false }, label:{//饼图不显示文字 show:true, position : 'inner',//饼图图上显示百分比 formatter : function (params) { return (params.percent - 0).toFixed(0) + '%' }, textStyle:{ fontSize:14 } } } } }, { name:'掉线数占比', type:'pie', center: ['50%', '75%'], radius: [0, '25%'], data:[{name:'a4',value:12}, {name:'b4',value:20}, {name:'c4',value:14}], itemStyle: {//系列级个性化 normal: { color: function(params) { var colorList = [ '#339CD1','#FE8463','#9BCA63','#FAD860', '#9CD2ED','#F8AB96','#80BF35','#F3C72C','#C1232B' ]; return colorList[params.dataIndex] }, labelLine:{//饼图不显示线条 length:2, show:false }, label:{//饼图不显示文字 show:true, position : 'inner',//饼图图上显示百分比 formatter : function (params) { return (params.percent - 0).toFixed(0) + '%' }, textStyle:{ fontSize:14 } } } } }, { name:'掉线数占比', type:'pie', center: ['80%', '75%'], radius: [0, '25%'], data:[{name:'a5',value:314}, {name:'b5',value:200}, {name:'c5',value:140}], itemStyle: {//系列级个性化 normal: { color: function(params) { var colorList = [ '#339CD1','#FE8463','#9BCA63','#FAD860', '#9CD2ED','#F8AB96','#80BF35','#F3C72C','#C1232B' ]; return colorList[params.dataIndex] }, labelLine:{//饼图不显示线条 length:2, show:false }, label:{//饼图不显示文字 show:true, position : 'inner',//饼图图上显示百分比 formatter : function (params) { return (params.percent - 0).toFixed(0) + '%' }, textStyle:{ fontSize:14 } } } } }, ] };
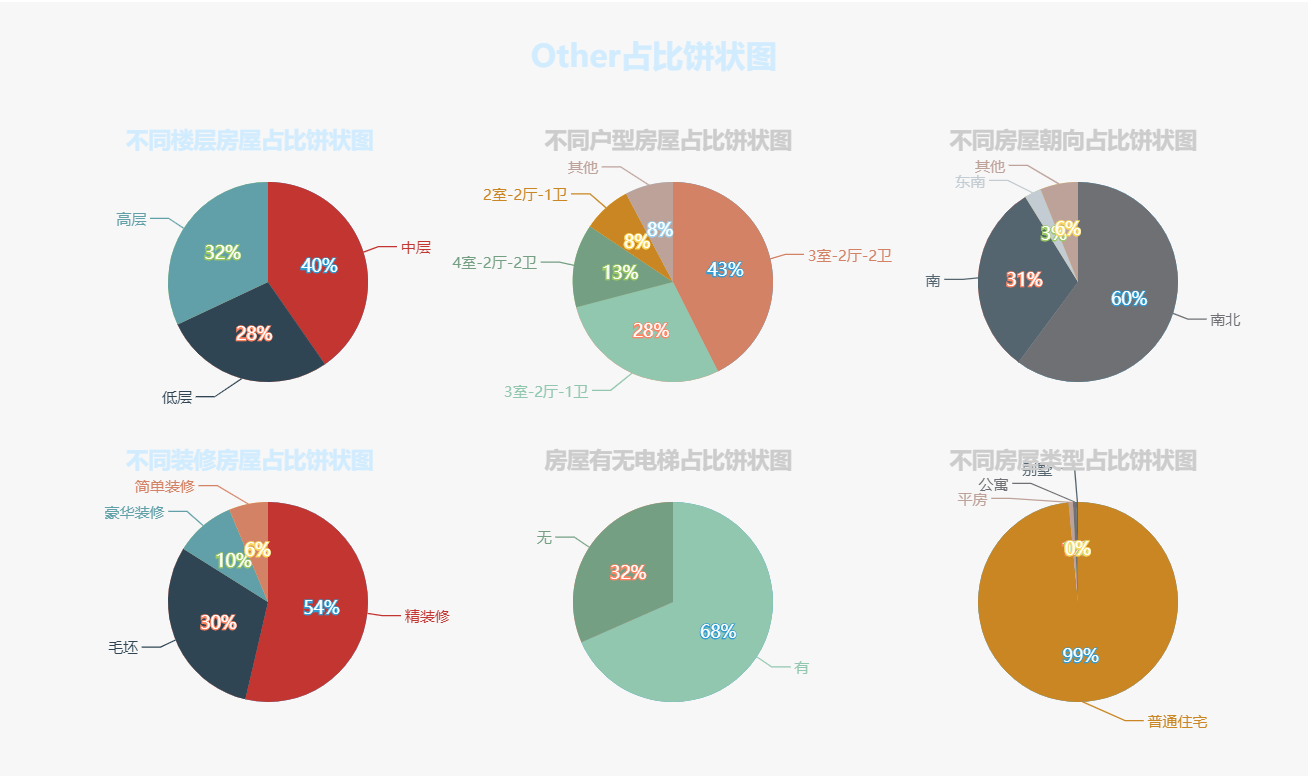
在echart运行中显示:

echart代码有了,我们需结合django+数据分析的代码应用到echart中,
1.得到数据分析的数据是series数据类型
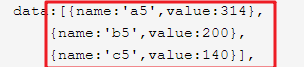
从echart要求的数据格式是如类型:
2.把series数据类型转为字典格式
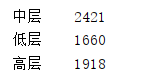
##部分数据分析代码

s = ("name","values")    #定义键
# print(count_by_floor.index.tolist(),count_by_floor.values)
d1 = [count_by_floor, new_count_by_model,new_count_by_forword, count_by_zx_extent,count_by_lift,count_by_home_tpye]
for dd in d1:       #遍历数据
    l = []
    pp = dd.to_dict()       #转为字典 如 {'中层': 2421, '低层': 1660, '高层': 1918}
    oo = zip(pp.keys(),pp.values())     #把字典转为元组    (('中层', 2421), ('低层', 1660), ('高层', 1918))
    for i in oo:
        l.append(dict(zip(s,i)))        #使用zip函数跟键结合并放入列表  [{'name': '中层', 'values': 2421}, {'name': '低层', 'values': 1660}, {'name': '高层', 'values': 1918}]
    list_all.append(l)              #放入大列表
大列表list_all
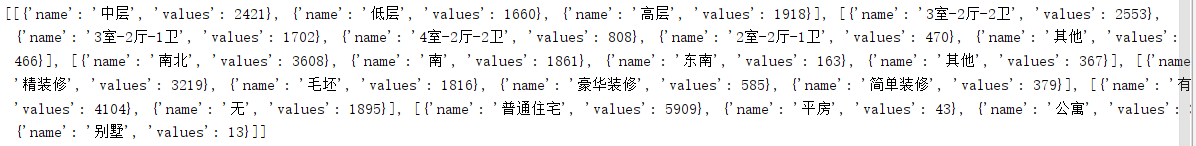
发现得到的数据跟echart的格式还是不一样,echart的格式很像字典,但它的键没有引号,在处理这点上花费了很长时间,起初想在数据分析代码中把引号去掉,报的是 不是字典的错误,然后换思路,换到view中去处理
view代码:
#部分代码

#other
        other_all = other()     #接收大列表
        #把大列表转为字符串再去把值替换
        other_all = str(other_all).replace("'name'","name").replace("'values'","values")
        print(other_all)

        return render(request, 'mainpage/index.html', locals())
可以输出结果

但是格式是字符串,在templates只能显示一串字符,不能以列表去读取每个元素,所以我们可以在view中遍历other_all大列表,把小列表转为字符串,重新生成大列表other_l
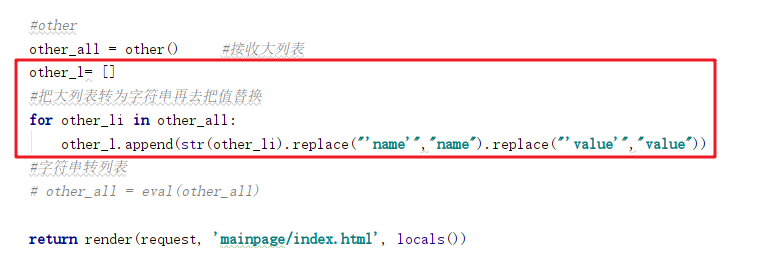
这样templates就可以接收参数了
得到图表
这里关于图表的文字显示跟百分比不能同时显示(没有更深的了解),我使用的是两个图表进行叠加的效果,例:

第一个:
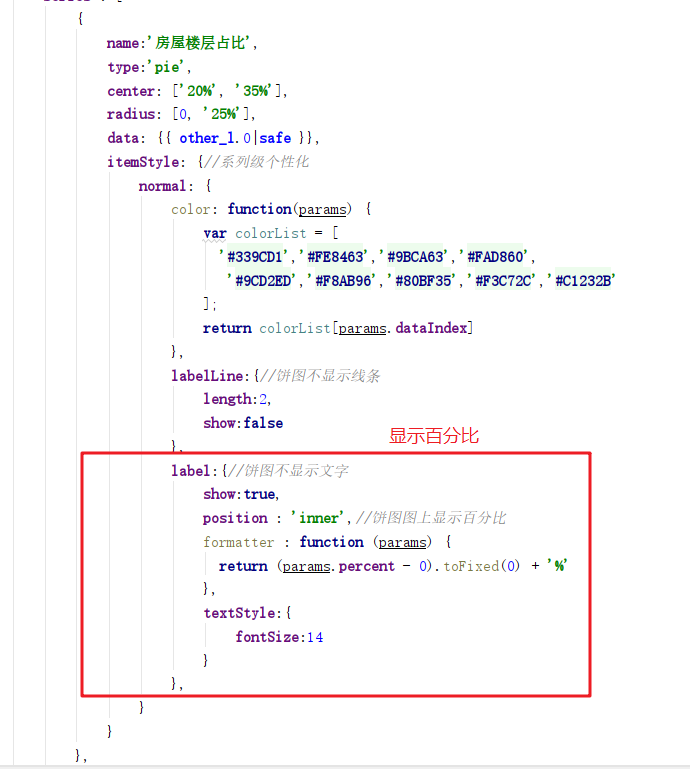
第二个:
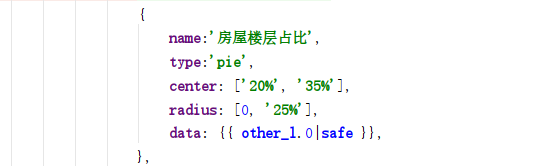
没有设置itemstyle则默认显示文字加线条
echart完整代码:
<div class="row"> <div class="col-md-9" align="center"> <div id="main3" style=" 1080px;height:640px;"></div> <script type="text/javascript"> var myChart = echarts.init(document.getElementById('main3')); option = { backgroundColor: '#f7f7f7',//背景颜色 tooltip : { show: true, formatter: "{a} <br/>{b} : {c} ({d}%)" }, title: [ { text: 'Other占比饼状图', top: '4%', left:'39%', textStyle:{ color:'#d1ecff', fontStyle:'normal', fontWeight:'600', fontFamily:'sans-serif', fontSize:25 } }, { text: '不同楼层房屋占比饼状图', top: '15%', left:'9%', textStyle:{ color:'#d1ecff', fontStyle:'normal', fontWeight:'600', fontFamily:'sans-serif', fontSize:18 } },{ text: "不同户型房屋占比饼状图", top:'15%', left:'40%', textStyle:{ color:'#ccc', fontStyle:'normal', fontWeight:'600', fontFamily:'sans-serif', fontSize:18 } }, { text: "不同房屋朝向占比饼状图", top: '15%', left: '70%', textStyle:{ color:'#ccc', fontStyle:'normal', fontWeight:'600', fontFamily:'sans-serif', fontSize:18 } }, { text: '不同装修房屋占比饼状图', top: '55%', left:'9%', textStyle:{ color:'#d1ecff', fontStyle:'normal', fontWeight:'600', fontFamily:'sans-serif', fontSize:18 } },{ text: "房屋有无电梯占比饼状图", top:'55%', left:'40%', textStyle:{ color:'#ccc', fontStyle:'normal', fontWeight:'600', fontFamily:'sans-serif', fontSize:18 } }, { text: "不同房屋类型占比饼状图", top: '55%', left: '70%', textStyle:{ color:'#ccc', fontStyle:'normal', fontWeight:'600', fontFamily:'sans-serif', fontSize:18 } }], toolbox: { show : false, feature : { mark : {show: true}, dataView : {show: true, readOnly: false}, restore : {show: true}, saveAsImage : {show: true} } }, calculable:false, series : [ { name:'房屋楼层占比', type:'pie', center: ['20%', '35%'], radius: [0, '25%'], data: {{ other_l.0|safe }}, itemStyle: {//系列级个性化 normal: { color: function(params) { var colorList = [ '#339CD1','#FE8463','#9BCA63','#FAD860', '#9CD2ED','#F8AB96','#80BF35','#F3C72C','#C1232B' ]; return colorList[params.dataIndex] }, labelLine:{//饼图不显示线条 length:2, show:false }, label:{//饼图不显示文字 show:true, position : 'inner',//饼图图上显示百分比 formatter : function (params) { return (params.percent - 0).toFixed(0) + '%' }, textStyle:{ fontSize:14 } }, } } }, { name:'房屋楼层占比', type:'pie', center: ['20%', '35%'], radius: [0, '25%'], data: {{ other_l.0|safe }}, }, { name:'房屋户型占比', type:'pie', center: ['50%', '35%'], radius: [0, '25%'], data:{{ other_l.1|safe }}, itemStyle: {//系列级个性化 normal: { color: function(params) { var colorList = [ '#339CD1','#FE8463','#9BCA63','#FAD860', '#9CD2ED','#F8AB96','#80BF35','#F3C72C','#C1232B' ]; return colorList[params.dataIndex] }, labelLine:{//饼图不显示线条 length:2, show:false }, label:{//饼图不显示文字 show:true, position : 'inner',//饼图图上显示百分比 formatter : function (params) { return (params.percent - 0).toFixed(0) + '%' }, textStyle:{ fontSize:14 } } } } }, { name:'房屋户型占比', type:'pie', center: ['50%', '35%'], radius: [0, '25%'], data:{{ other_l.1|safe }} }, { name:'房屋朝向占比', type:'pie', center: ['80%', '35%'], radius: [0, '25%'], data:{{ other_l.2|safe }}, itemStyle: {//系列级个性化 normal: { color: function(params) { var colorList = [ '#339CD1','#FE8463','#9BCA63','#FAD860', '#9CD2ED','#F8AB96','#80BF35','#F3C72C','#C1232B' ]; return colorList[params.dataIndex] }, labelLine:{//饼图不显示线条 length:2, show:false }, label:{//饼图不显示文字 show:true, position : 'inner',//饼图图上显示百分比 formatter : function (params) { return (params.percent - 0).toFixed(0) + '%' }, textStyle:{ fontSize:14 } } } } }, { name:'房屋朝向占比', type:'pie', center: ['80%', '35%'], radius: [0, '25%'], data:{{ other_l.2|safe }}, }, { name:'房屋装修占比', type:'pie', center: ['20%', '75%'], radius: [0, '25%'], data:{{ other_l.3|safe }}, itemStyle: {//系列级个性化 normal: { color: function(params) { var colorList = [ '#339CD1','#FE8463','#9BCA63','#FAD860', '#9CD2ED','#F8AB96','#80BF35','#F3C72C','#C1232B' ]; return colorList[params.dataIndex] }, labelLine:{//饼图不显示线条 length:2, show:false }, label:{//饼图不显示文字 show:true, position : 'inner',//饼图图上显示百分比 formatter : function (params) { return (params.percent - 0).toFixed(0) + '%' }, textStyle:{ fontSize:14 } } } } }, { name:'房屋装修占比', type:'pie', center: ['20%', '75%'], radius: [0, '25%'], data:{{ other_l.3|safe }}, }, { name:'有无电梯占比', type:'pie', center: ['50%', '75%'], radius: [0, '25%'], data:{{ other_l.4|safe }}, itemStyle: {//系列级个性化 normal: { color: function(params) { var colorList = [ '#339CD1','#FE8463','#9BCA63','#FAD860', '#9CD2ED','#F8AB96','#80BF35','#F3C72C','#C1232B' ]; return colorList[params.dataIndex] }, labelLine:{//饼图不显示线条 length:2, show:false }, label:{//饼图不显示文字 show:true, position : 'inner',//饼图图上显示百分比 formatter : function (params) { return (params.percent - 0).toFixed(0) + '%' }, textStyle:{ fontSize:14 } } } } }, { name:'有无电梯占比', type:'pie', center: ['50%', '75%'], radius: [0, '25%'], data:{{ other_l.4|safe }}, }, { name:'房屋类型占比', type:'pie', center: ['80%', '75%'], radius: [0, '25%'], data:{{ other_l.5|safe }}, itemStyle: {//系列级个性化 normal: { color: function(params) { var colorList = [ '#339CD1','#FE8463','#9BCA63','#FAD860', '#9CD2ED','#F8AB96','#80BF35','#F3C72C','#C1232B' ]; return colorList[params.dataIndex] }, labelLine:{//饼图不显示线条 length:2, show:false }, label:{//饼图不显示文字 show:true, position : 'inner',//饼图图上显示百分比 formatter : function (params) { return (params.percent - 0).toFixed(0) + '%' }, textStyle:{ fontSize:14 } } } } }, { name:'房屋类型占比', type:'pie', center: ['80%', '75%'], radius: [0, '25%'], data:{{ other_l.5|safe }}, }, ] }; //使用刚指定的配置项和数据显示图表 myChart.setOption(option); </script> </div> </div>
之后查了资料,可以通过eval()函数来实现字符串转列表的形式
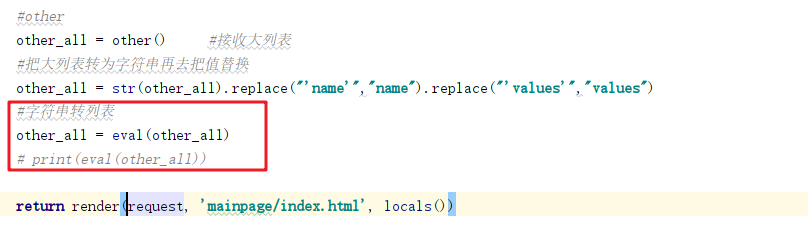
结果转换的时候就报了个格式错误,跟在数据分析代码的错误差不多。
然后又查了在templates中自定义过滤器,还没弄懂,弄懂了在写。