show the code:
# Plot training deviance
def plot_training_deviance(clf, n_estimators, X_test, y_test):
    # compute test set deviance
    test_score = np.zeros((n_estimators,), dtype=np.float64)
    for i, y_pred in enumerate(clf.staged_predict(X_test)):
        test_score[i] = clf.loss_(y_test, y_pred)
    plt.figure(figsize=(12, 6))
    plt.subplot(1, 2, 1)
    plt.title('Deviance')
    train_score = clf.train_score_
    logging.info("len(train_score): %s" % len(train_score))
    logging.info(train_score)
    logging.info("len(test_score): %s" % len(test_score))
    logging.info(test_score)
    plt.plot(np.arange(n_estimators) + 1, train_score, 'b-',
             label='Training Set Deviance')
    plt.plot(np.arange(n_estimators) + 1, test_score, 'r*', label='Test Set Deviance')
    plt.legend(loc='upper right')
    plt.xlabel('Boosting Iterations')
    plt.ylabel('Deviance')
    plt.show()


# Plot feature importance
def plot_feature_importance(clf, feature_names):
    feature_importance = clf.feature_importances_
    # make importances relative to max importance
    feature_importance = 100.0 * (feature_importance / feature_importance.max())
    sorted_idx = np.argsort(feature_importance)
    pos = np.arange(sorted_idx.shape[0]) + .5
    plt.subplot(1, 2, 2)
    plt.barh(pos, feature_importance[sorted_idx], align='center')
    # plt.yticks(pos, feature_names[sorted_idx])
    plt.yticks(pos, [feature_names[idx] for idx in sorted_idx])
    plt.xlabel('Relative Importance')
    plt.title('Variable Importance')
    plt.show()


class Train(object):
    def __init__(self, data_file):
        self.data_file = data_file
        self.x_fields = ["xxx", "xxx", "xxx"]
        self.x_features, self.y_labels = self.load_data()

    def load_data(self):
        x_features, y_labels = [], []
        # ......
        return x_features, y_labels

    def train_model(self):
        model = GradientBoostingRegressor(random_state=42)
        model.fit(self.x_features, self.y_labels)
        y_pred = model.predict(self.x_features)
        logging.info("mean_squared_error: %.6f" % mean_squared_error(self.y_labels, y_pred))
        logging.info("mean_squared_log_error: %.6f" % mean_squared_log_error(self.y_labels, y_pred))

        plot_training_deviance(clf=model, n_estimators=model.get_params()["n_estimators"], X_test=self.x_features, y_test=self.y_labels)

        # 输出feature重要性
        logging.info("feature_importances_: %s" % model.feature_importances_)
        plot_feature_importance(clf=model, feature_names=self.x_fields)
参考的是sklearn中的样例: Gradient Boosting regression — scikit-learn 0.19.2 documentation
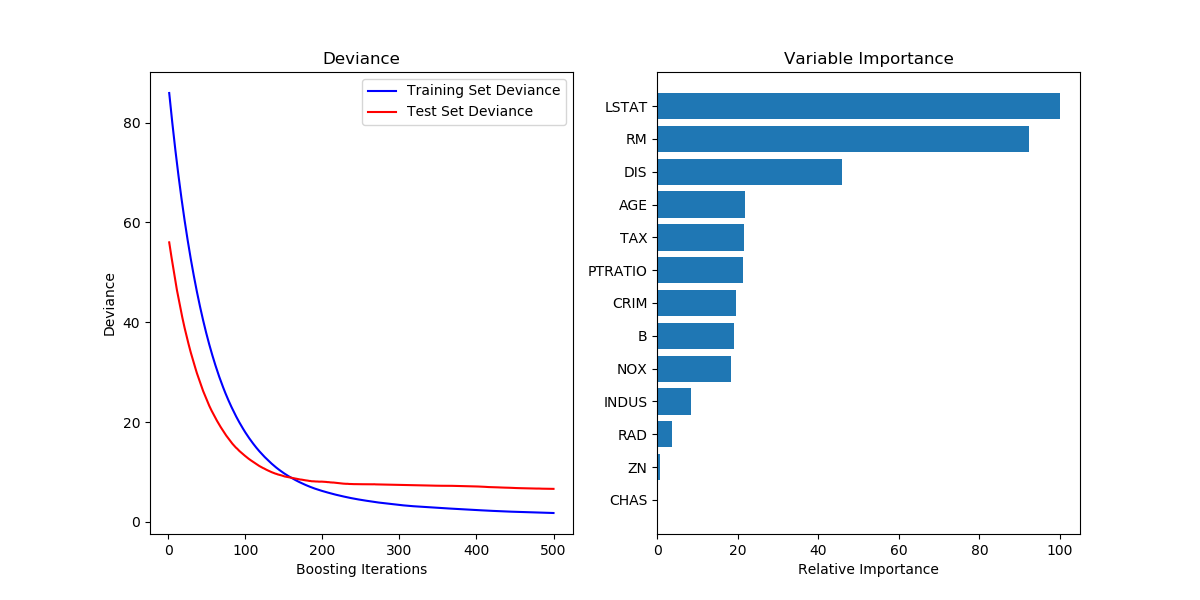
画出的图如下所示: