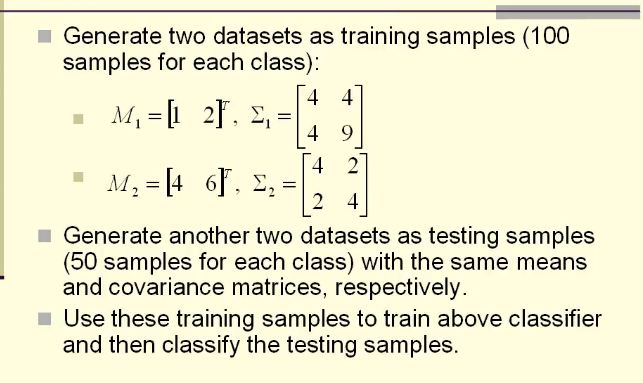
看李政轩老师讲的Kernel,讲的非常好!前面有几道作业题,用MATLAB简单做了下,不知道对不对,错误之处还请指出。
题目是这样的。
一、MATLAB版本:
clear;
clc
% 生成training sample
MU1 = [1 2];
MU2 = [4 6];
SIGMA1 = [4 4; 4 9];
SIGMA2 = [4 2; 2 4];
M1 = mvnrnd(MU1,SIGMA1,100);
M2 = mvnrnd(MU2,SIGMA2,100);
%生成testing sample
TEST1 = mvnrnd(MU1,SIGMA1,50);
TEST2 = mvnrnd(MU2,SIGMA2,50);
%向量化的计算
%中间点C
C = (MU1+MU2)/2;
C_M = repmat(C,50,1);
%MUi vector
TRAIN_V = MU1 - MU2;
TRAIN_V_M = repmat(TRAIN_V,50,1);
%TEST vector
TEST1_V = TEST1 - C_M;
TEST2_V = TEST2 - C_M;
%预测第一个测试集
num1 = 0;
for (i=1:50)
d = dot(TRAIN_V,TEST1_V(i,:));
if d >0
num1 = num1 + 1;
end
end
disp(['测试集1输入数据数量为:',num2str(length(TEST1_V)),'正确分类的数量为:',num2str(num1)])
disp(['测试集1的预测准确度为:',num2str(num1/length(TEST1_V))])
num2 = 0;
for (i=1:50)
d = dot(TRAIN_V,TEST2_V(i,:));
if d <0
num2 = num2 + 1;
end
end
disp(['测试集2输入数据数量为:',num2str(length(TEST2_V)),'正确分类的数量为:',num2str(num2)])
disp(['测试集2的预测准确度为:',num2str(num2/length(TEST2_V))])
%两样本中心值连线的斜率
K = TRAIN_V(2)/TRAIN_V(1);
%两样本中心值连线的中垂线的斜率
k = K/(-1);
x = min(TEST1):0.1:max(TEST2);
y = k*(x-C(1))+C(2);
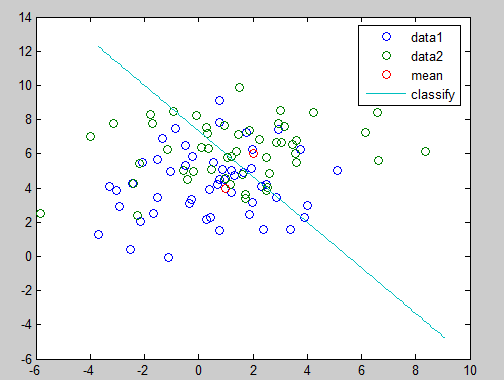
plot(TEST1,TEST2,'O',MU1,MU2,'o',x,y)
输出如下:

作图:
二、python3版本
注意这里原始的training data 做了改动,原理是一样的。
# -*- coding: utf-8 -*-
"""
Created on Sun Nov  6 20:02:02 2016

@author: Administrator
"""

import numpy as np
from matplotlib import pyplot as plt


# train matrix
def get_train_data():
	M1 = np.random.random((100,2))
	M2 = np.random.random((100,2)) - 0.7
	plt.plot(M1[:,0],M1[:,1], 'ro')
	plt.plot(M2[:,0],M2[:,1], 'go')
	return M1,M2

def classify(M1,M2,test_data):
	mean1 = np.mean(M1, axis=0)
	mean2 = np.mean(M2, axis=0)
	mean = (mean1 + mean2)/2
	# for plot
	km = (mean1[1]-mean2[1])/(mean1[0]-mean2[0])
	k = km/(-1)
	min_x = np.min(M2)
	max_x = np.max(M1)
	x = np.linspace(min_x, max_x, 100)
	y = k*(x-mean[0])+mean[1]
	plt.plot(x,y,'y')

	vector_train = mean1 - mean
	vector_test = test_data - mean
	vector_dot = np.dot(vector_train, vector_test)
	sgn = np.sign(vector_dot)

	return sgn

def get_test_data():
	M = np.random.random((50,2))
	plt.plot(M[:,0],M[:,1],'*y')
	return M

if __name__=="__main__":
	M1,M2 = get_train_data()
	test_data = get_test_data()
	right_count = 0
	for test_i in test_data:
		classx = classify(M1,M2,test_i)
		if classx == 1:
			right_count += 1
	plt.show()
	print("The accuracy of right classification is %s"%str(right_count/len(test_data)))
输出:

