echarts数据视图原生态的js的样式会出现变形,需要在optionToContent处添加自定义函数。
可以自定义optionToContent函数:
optionToContent: function (opt) {
    let axisData = opt.xAxis[0].data; //坐标数据
    let series = opt.series; //折线图数据
    let tdHeads = '<td  >时间</td>'; //表头
    let tdBodys = ''; //数据
    series.forEach(function (item) {
        //组装表头
        tdHeads += `<td >${item.name}</td>`;
    });
    let table = `<table border="1" ><tbody><tr>${tdHeads} </tr>`;
    for (let i = 0, l = axisData.length; i < l; i++) {
        for (let j = 0; j < series.length; j++) {
            //组装表数据
            tdBodys += `<td>${ series[j].data[i]}</td>`;
        }
        table += `<tr><td >${axisData[i]}</td>${tdBodys}</tr>`;
        tdBodys = '';
    }
    table += '</tbody></table>';
    return table;
}
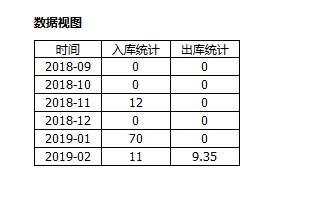
下面是展示效果: