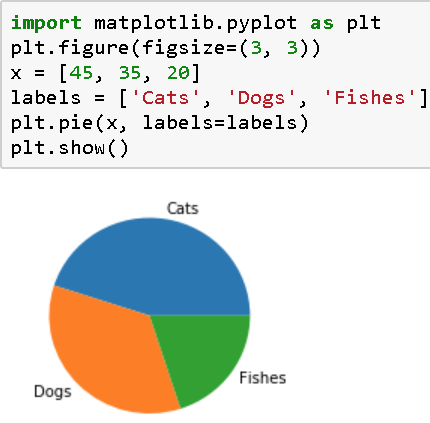
import matplotlib.pyplot as plt
plt.figure(figsize=(3, 3))
x = [45, 35, 20]
labels = ['Cats', 'Dogs', 'Fishes']
plt.pie(x, labels=labels)
plt.show()
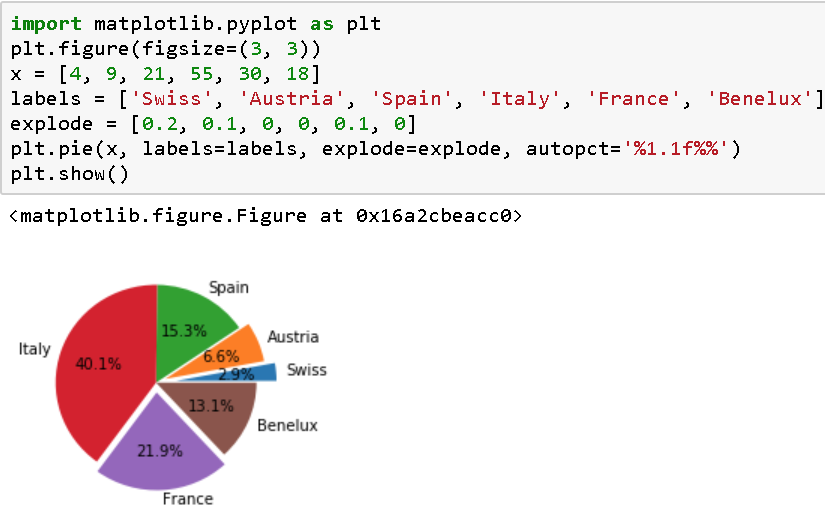
import matplotlib.pyplot as plt
plt.figure(figsize=(3, 3))
x = [4, 9, 21, 55, 30, 18]
labels = ['Swiss', 'Austria', 'Spain', 'Italy', 'France', 'Benelux']
explode = [0.2, 0.1, 0, 0, 0.1, 0]
plt.pie(x, labels=labels, explode=explode, autopct='%1.1f%%')
plt.show()
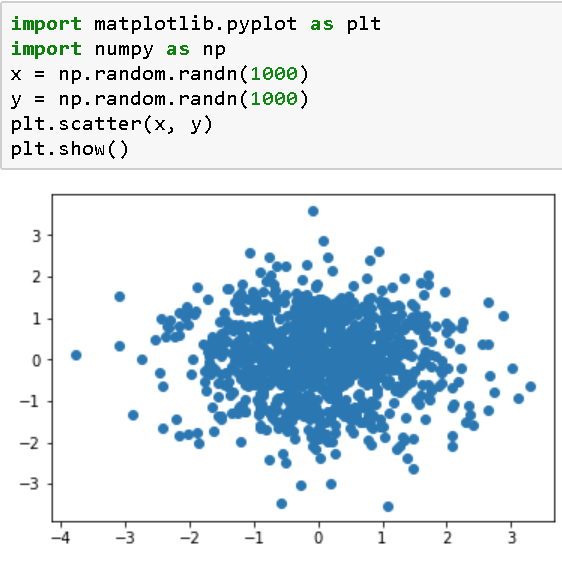
# Scatter plots
import matplotlib.pyplot as plt
import numpy as np
x = np.random.randn(1000)
y = np.random.randn(1000)
plt.scatter(x, y)
plt.show()
size = 50 * np.random.randn(1000)
colors = np.random.rand(1000)
plt.scatter(x, y, s=size, c=colors)
plt.show()
# Polar charts
import matplotlib.pyplot as plt
import numpy as np
theta = np.arange(0., 2., 1./180.) * np.pi
plt.polar(3 * theta, theta / 5)
plt.polar(theta, np.cos(4*theta))
plt.polar(theta, [1.4]*len(theta))
plt.show()
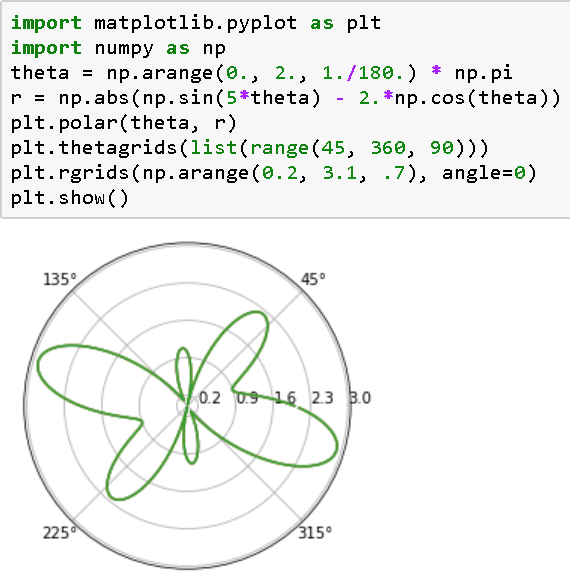
import matplotlib.pyplot as plt
import numpy as np
theta = np.arange(0., 2., 1./180.) * np.pi
r = np.abs(np.sin(5*theta) - 2.*np.cos(theta))
plt.polar(theta, r)
plt.thetagrids(list(range(45, 360, 90)))
plt.rgrids(np.arange(0.2, 3.1, .7), angle=0)
plt.show()
import matplotlib.pyplot as plt
import numpy as np
x = np.arange(0, 2*np.pi, .01)
y = np.sin(x)
plt.plot(x, y)
plt.text(0.1, -0.04, 'sin(0)=0')
plt.show()
# Annotations
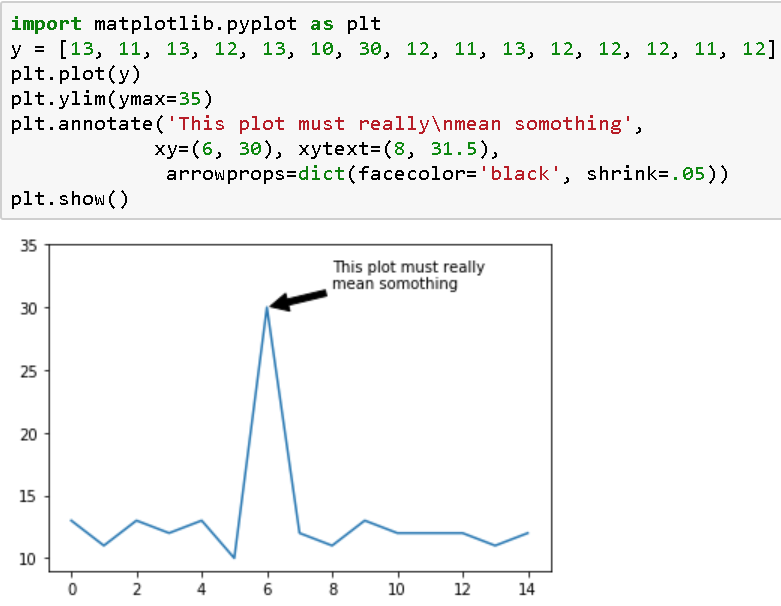
import matplotlib.pyplot as plt
y = [13, 11, 13, 12, 13, 10, 30, 12, 11, 13, 12, 12, 12, 11, 12]
plt.plot(y)
plt.ylim(ymax=35)
plt.annotate('This plot must really
mean somothing',
xy=(6, 30), xytext=(8, 31.5),
arrowprops=dict(facecolor='black', shrink=.05))
plt.show()
import matplotlib.pyplot as plt
plt.axis([0, 10, 0, 20])
arrstyles = ['-', '->', '-[', '<-', '<->', 'fancy', 'simple', 'wedge']
for i, style in enumerate(arrstyles):
plt.annotate(style, xytext=(1, 2+2*i), xy=(4, 1+2*i),
arrowprops=dict(arrowstyle=style))
connstyles = ['arc', 'arc, angleA=10, armA=30, rad=15',
'arc3, rad=.2', 'arc3, rad=-.2', 'angle', 'angle3']
for i, style in enumerate(connstyles):
plt.annotate("", xytext=(6, 2+2*i), xy=(8, 1+2*i),
arrowprops=dict(arrowstyle='->', connectionstyle=style))
plt.show()