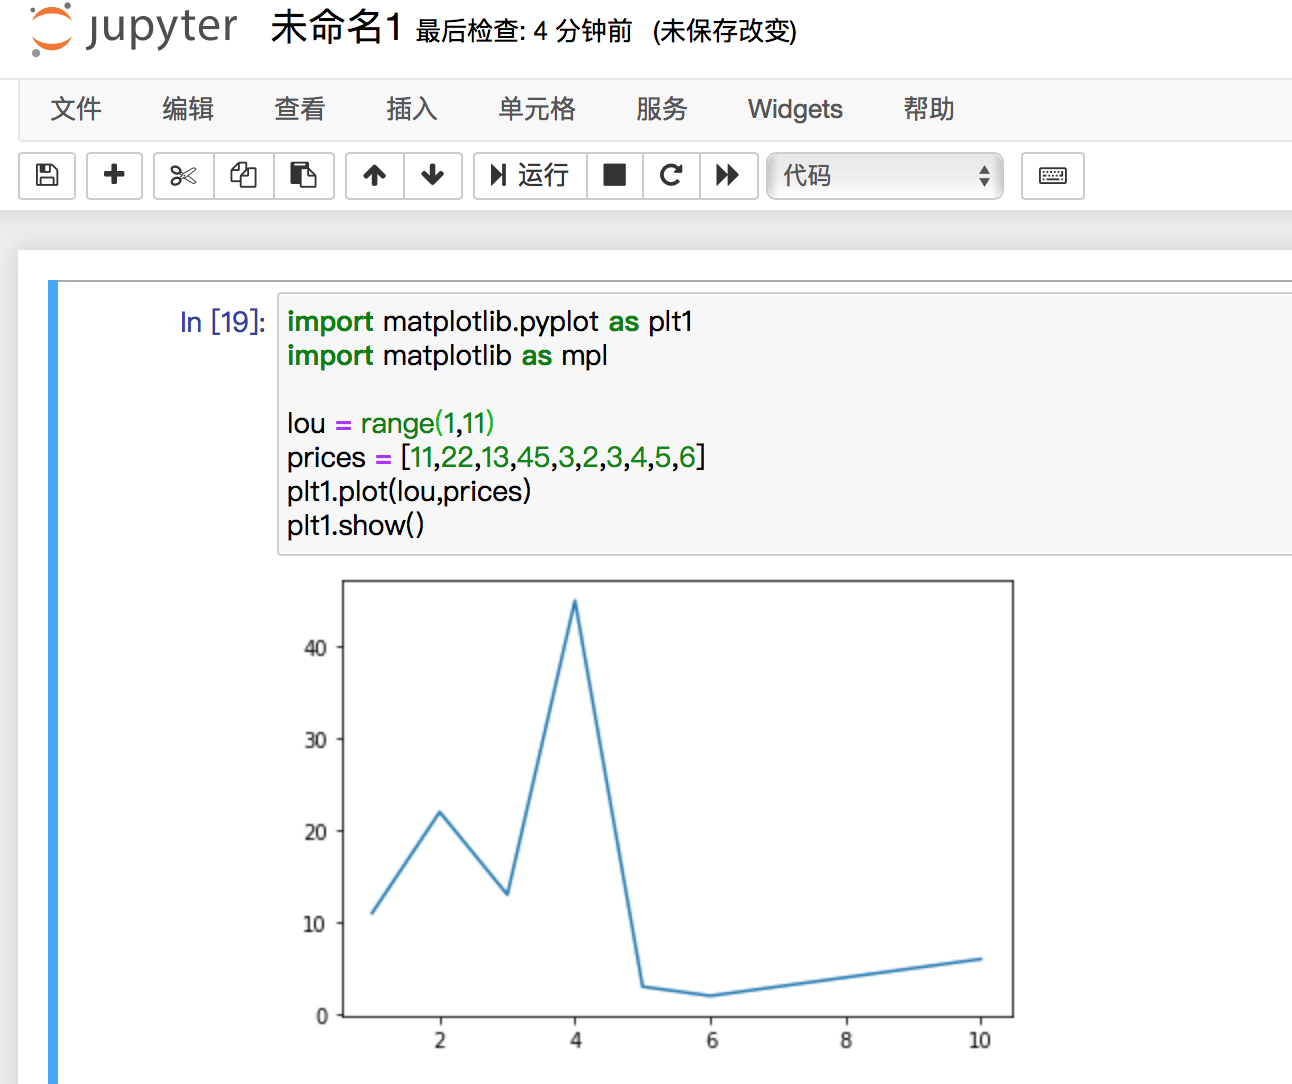
import matplotlib.pyplot as plt1
import matplotlib as mpl

x = range(1,11)
y = [11,22,13,45,3,2,3,4,5,6]
plt1.plot(x,y)
plt1.show()
x 和y 个数不一致就报错
ValueError: x and y must have same first dimension, but have shapes (10,) and (11,)
import matplotlib.pyplot as plt1 import matplotlib as mpl x = range(1,11) y = [11,22,13,45,3,2,3,4,5,6] plt1.plot(x,y) plt1.show()
x 和y 个数不一致就报错
ValueError: x and y must have same first dimension, but have shapes (10,) and (11,)