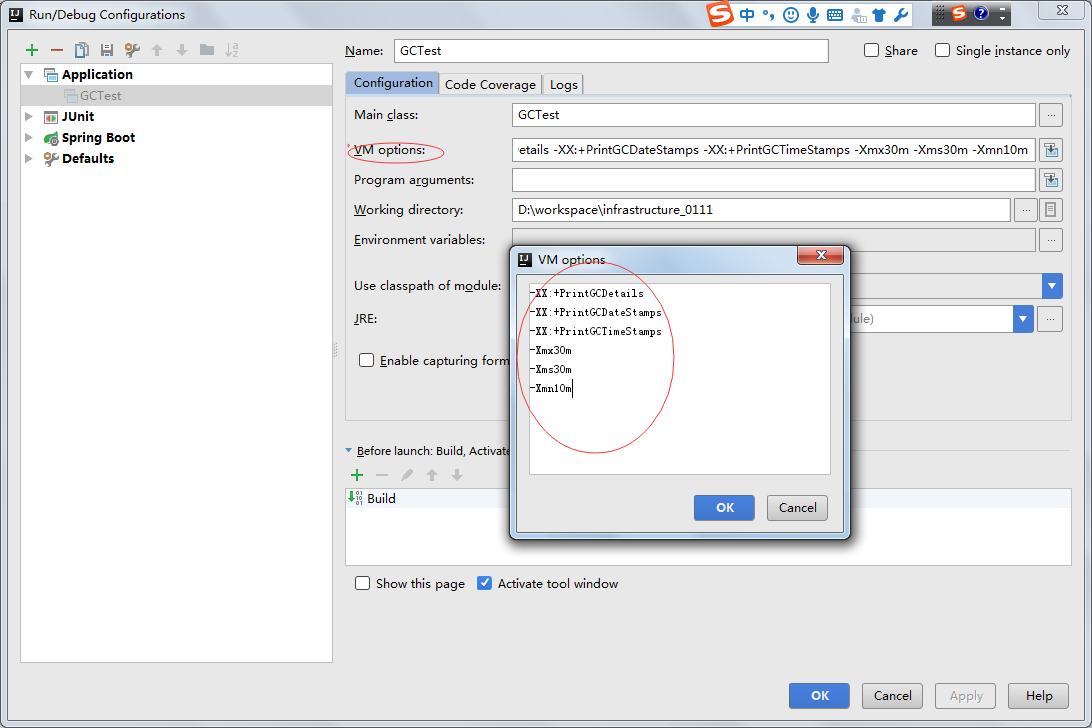
一:设置jvm参数
二:测试代码
public static void main(String[] args) {
        List list = new ArrayList();
        for (int i = 0; i < 7; i++) {
            System.out.println("<--" + i);
            list.add(new byte[3 * 1024 * 1024]);
            System.out.println(i + "-->");
        }
        list.clear();
        for (int i = 0; i < 2; i++) {
            System.out.println("<--" + i);
            list.add(new byte[3 * 1024 * 1024]);
            System.out.println(i + "-->");
        }
    }
三:输出结果
<--0
0-->
<--1
2018-02-01T10:33:20.067+0800: 1.847: [GC (Allocation Failure) [PSYoungGen: 5368K->1012K(9216K)] 5368K->4108K(29696K), 0.0169275 secs] [Times: user=0.01 sys=0.01, real=0.02 secs]
1-->
<--2
2-->
<--3
2018-02-01T10:33:20.090+0800: 1.870: [GC (Allocation Failure) [PSYoungGen: 7310K->996K(9216K)] 10406K->10268K(29696K), 0.0606608 secs] [Times: user=0.11 sys=0.00, real=0.06 secs]
3-->
<--4
4-->
<--5
2018-02-01T10:33:20.151+0800: 1.932: [GC (Allocation Failure) [PSYoungGen: 7296K->1012K(9216K)] 16568K->16428K(29696K), 0.0293586 secs] [Times: user=0.05 sys=0.00, real=0.03 secs]
2018-02-01T10:33:20.181+0800: 1.961: [Full GC (Ergonomics) [PSYoungGen: 1012K->0K(9216K)] [ParOldGen: 15416K->16370K(20480K)] 16428K->16370K(29696K), [Metaspace: 2936K->2936K(1056768K)], 0.0618997 secs] [Times: user=0.08 sys=0.00, real=0.06 secs]
5-->
<--6
6-->
<--0
2018-02-01T10:33:20.252+0800: 2.032: [Full GC (Ergonomics) [PSYoungGen: 6301K->0K(9216K)] [ParOldGen: 16370K->1010K(20480K)] 22672K->1010K(29696K), [Metaspace: 2936K->2936K(1056768K)], 0.3242995 secs] [Times: user=0.20 sys=0.00, real=0.32 secs]
0-->
<--1
1-->
Heap
PSYoungGen total 9216K, used 6548K [0x00000000ff600000, 0x0000000100000000, 0x0000000100000000)
eden space 8192K, 79% used [0x00000000ff600000,0x00000000ffc651c8,0x00000000ffe00000)
from space 1024K, 0% used [0x00000000ffe00000,0x00000000ffe00000,0x00000000fff00000)
to space 1024K, 0% used [0x00000000fff00000,0x00000000fff00000,0x0000000100000000)
ParOldGen total 20480K, used 1010K [0x00000000fe200000, 0x00000000ff600000, 0x00000000ff600000)
object space 20480K, 4% used [0x00000000fe200000,0x00000000fe2fca00,0x00000000ff600000)
Metaspace used 2943K, capacity 4486K, committed 4864K, reserved 1056768K
class space used 311K, capacity 386K, committed 512K, reserved 1048576K
四:数据含义解析

1.2018-02-01T10:33:20.151+0800:GC事件(GC event)开始的时间点
2.1.932:GC时间的开始时间,相对于JVM的启动时间,单位是秒(Measured in seconds)
3.GC:用来区分(distinguish)是 Minor GC 还是 Full GC 的标志(Flag). 这里的 GC 表明本次发生的是 Minor GC
4.Allocation Failure:引起垃圾回收的原因. 本次GC是因为年轻代中没有任何合适的区域能够存放需要分配的数据结构而触发的
5.PSYoungGen:使用的垃圾收集器的名字
6.7296K->1012K:在本次垃圾收集之前和之后的年轻代内存使用情况(Usage)
7.9216K:年轻代的总的大小(Total size)
8.16568K->16428K:在本次垃圾收集之前和之后整个堆内存的使用情况(Total used heap)
9.29696K:总的可用的堆内存(Total available heap)
10.0.0293586 secs:GC事件的持续时间(Duration),单位是秒
11.[Times: user=0.05 sys=0.00, real=0.03 secs]:GC事件的持续时间,通过多种分类来进行衡量
user:此次垃圾回收, 垃圾收集线程消耗的所有CPU时间(Total CPU time)
sys:操作系统调用(OS call) 以及等待系统事件的时间(waiting for system event)
real:应用程序暂停的时间(Clock time). 由于串行垃圾收集器(Serial Garbage Collector)只会使用单个线程, 所以 real time 等于 user 以及 system time 的总和
1012K