调试chromium设置 How to enable logging


To enable logging, launch Chrome with these command line flags:
 
--enable-logging=stderr --v=1                 # Output will be printed to standard error (eg. printed in the console)
--enable-logging=stderr --v=1 > log.txt 2>&1  # Capture stderr and stdout to a log file
 
  • This will turn on full logging support (INFO, WARNING, ERROR, and VERBOSE0 for >=M9).
  • See newer instructions for Linux at docs/linux/debugging.md
  • If you are debugging renderer startup on Windows, we recommend you enable histogram logging for additional debugging by using the extra command line --vmodule=metrics=2
  • Verbose logging shows up with their own VERBOSEn label.
    • --vmodule enables verbose logging on a per module basis. Details in base/logging.h.
  • Any page load (even the new tab page) will print messages tagged with VERBOSE1; for example:
  •     [28304:28320:265508881314:VERBOSE1:chrome/browser/renderer_host/resource_dispatcher_host.cc(1098)] OnResponseStarted: chrome://newtab/
  • The output will be saved to the file chrome_debug.log in Chrome's user data directory 
    • Release builds: The parent directory of Default/.
    • Debug builds: The binary build folder (e.g. outDebug).
    • Chrome OS
      • Open file:///var/log/messages
      • /var/log/chrome at the login screen.
      • Files within the log subdirectory under the logged-in user's encrypted home directory, which resides under /home/chronos.
  • Logs are overwritten each time you restart chrome.
  • To enable logging from the render processes on Windows you also need the --no-sandbox command line flag.
     
  • To see WTF_LOG, use --blink-platform-log-channels
Note that:
  • If the environment variable CHROME_LOG_FILE is set, Chrome will write its debug log to its specified location.  Example: Setting CHROME_LOG_FILE to "chrome_debug.log" will cause the log file to be written to the Chrome process's current working directory while setting it to "D:chrome_debug.log" will write the log to the root of your computer's D: drive.
  • To override the log file path in a test harness that runs Chrome, use this pattern:
    #include "chrome/common/env_vars.h"
    ...
    // Set the log file path in the environment for the test browser.
    std::wstring log_file_path = ...;
    SetEnvironmentVariable(env_vars::kLogFileName, log_file_path.c_str());

How do I specify the command line flags?

See command line flags page.

What personal information does the log file contain?

Before attaching your chrome_debug.log to a bug report, be aware that it can contain some personal information, such as URLs opened during that session of chrome.
 
Since the debug log is a human-readable text file, you can open it up with a text editor (notepad, vim, etc..) and review the information it contains, and erase anything you don't want the bug investigators to see.
 
The boilerplate values enclosed by brackets on each line are in the format:
 
[process_id:thread_id:ticks_in_microseconds:log_level:file_name(line_number)]

Sawbuck

Alternatively to the above, you can use the Sawbuck utility (for Windows) to view, filter and search the logs in realtime, in a handy-dandy GUI.
 
First download and install the latest version of Sawbuck, launch it, then select "Configure Providers.." form the "Log" menu.
This will bring up a dialog that looks something like this:
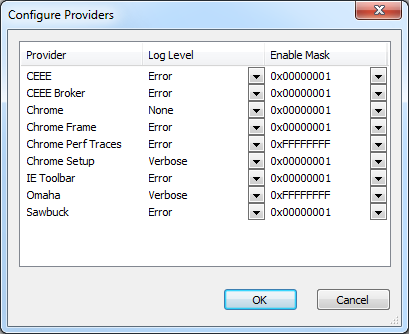
Set the log level for Chrome, Chrome Frame, and/or the Setup program to whatever suits you, and click "OK". You can revisit this dialog at any time to increase or decrease the log verbosity.
Now select "Capture" from the "Log" menu, and you should start seeing Chrome's log messages.
Note that Sawbuck has a feature that allows you to view the call trace for each log message, which can come in handy when you're trying to home in on a particular problem.
 
Note for 64-bit Chrome: Reporting of callstacks, source file, and line info does not currently work when originating from 64-bit Chrome, and log messages will be garbage by default (https://crbug.com/456884). Change the "Enable Mask" for the Chrome and Chrome Setup providers so that "Text Only" is the only option selected to have non-garbaled log messages.


Run Chromium with flags

There are command line flags (or "switches") that Chromium (and Chrome) accept in order to enable particular features or modify otherwise default functionality.

Current switches may be found at http://peter.sh/examples/?/chromium-switches.html

It is important to note that some switches are intended for temporary cases and may break in the future.

Note that if you look at chrome://flags to see if the command line option is active, the state might not be accurately reflected. Check chrome://version for the complete command line used in the current instance.

Windows

  1. Exit any running-instance of Chrome.
  2. Right click on your "Chrome" shortcut.
  3. Choose properties.
  4. At the end of your "Target:" line add the command line flags. For example:
    • --disable-gpu-vsync
  5. With that example flag, it should look like below (replacing "--disable-gpu-vsync" with any other command line flags you want to use):
    chrome.exe --disable-gpu-vsync
  6. Launch Chrome like normal with the shortcut.

macOS

  1. Quit any running instance of Chrome.
  2. Run your favorite Terminal application.
  3. In the terminal, run commands like below (replacing "--remote-debugging-port=9222" with any other command line flags you want to use):
    /Applications/Chromium.app/Contents/MacOS/Chromium --remote-debugging-port=9222

    # For Google Chrome you'll need to escape spaces like so:
    /Applications/Google Chrome.app/Contents/MacOS/Google Chrome --remote-debugging-port=9222

Linux

  1. Quit any running instance of Chrome.
  2. Run your favorite terminal emulator.
  3. In the terminal, run commands like below (replacing "--remote-debugging-port=9222" with any other command line flags you want to use):
    chromium-browser --remote-debugging-port=9222
    google-chrome --foo --bar=2

V8 Flags

V8 can take a number of flags as well, via Chrome's js-flags flag. For example, this traces V8 optimizations:

chrome.exe --js-flags="--trace-opt --trace-deopt --trace-bailout"

To get a listing of all possible V8 flags:

chrome.exe --js-flags="--help"

Browse the V8 wiki for more flags for V8.

Android

Visit 'about:version' to review the flags that are effective in the app. 

If you are running on a rooted device or using a debug build of Chromium, then you can set flags like so:

out/Default/bin/chrome_public_apk argv  # Show existing flags.
out/Default/bin/content_shell_apk argv --args='--foo --bar'  # Set new flags

You can also install, set flags, and launch with a single command:

out/Default/bin/chrome_public_apk run --args='--foo --bar'
out/Default/bin/content_shell_apk run  # Clears any existing flags

For production build on a non-rooted device, you need to enable "Enable command line on non-rooted devices" in chrome://flags, then set command line in /data/local/tmp/chrome-command-line. When doing that, mind that the first command line item should be a "_" (underscore) followed by the ones you actually need. Finally, manually restart Chrome ("Relaunch" from chrome://flags page might no be enough to trigger reading this file). See https://crbug.com/784947.

ContentShell on Android

There's an alternative method for setting flags with ContentShell that doesn't require building yourself:

  1. Download a LKGR build of Android.
  2. This will include both ChromePublic.apk and ContentShell.apk
  3. Install ContentShell APK to your device.
  4. Run this magic incantation
adb shell am start
  -a android.intent.action.VIEW
  -n org.chromium.content_shell_apk/.ContentShellActivity
  --es activeUrl "http://chromium.org"
  --esa commandLineArgs --show-paint-rects,--show-property-changed-rects

This will launch contentshell with the supplied flags. You can apply whatever commandLineArgs you want in that syntax.

Android WebView

This is documented in the chromium tree.

Chrome OS

  1. Put the device into dev mode, disable rootfs verification, and bring up a command prompt.
  2. Modify /etc/chrome_dev.conf (read the comments in the file for more details).
  3. Restart the UI via:
    sudo restart ui
原文地址:https://www.cnblogs.com/bigben0123/p/13277681.html