一.数据爬取和数据入库
在使用jsoup爬取数据出现一定问题之后,我改变了方法采用Python来快速爬取疫情数据。
经过一定时间学习Python相关知识后采用了requests 里的一些方法和 json 格式的转换以及就是数据库的添加操作。
爬取代码如下
import requests
import json
from pymysql import *
import requests
from retrying import retry

headers = {
    "User-Agent": "Mozilla/5.0 (Linux; Android 6.0; Nexus 5 Build/MRA58N) AppleWebKit/537.36 (KHTML, like Gecko) Chrome/80.0.3987.132 Mobile Safari/537.36"
    , "Referer": "https://wp.m.163.com/163/page/news/virus_report/index.html?_nw_=1&_anw_=1"}


def _parse_url(url):
    response = requests.get(url, headers=headers, timeout=3)  # 3秒之后返回
    return response.content.decode()


def parse_url(url):
    try:
        html_str = _parse_url(url)
    except:
        html_str = None
    return html_str


class yiqing:
    url = "https://c.m.163.com/ug/api/wuhan/app/data/list-total?t=316765429316"

    def getContent_list(self, html_str):
        dict_data = json.loads(html_str)
        # 各省的数据
        content_list = dict_data["data"]

        return content_list

    def saveContent_list(self, i):
        # 打开数据库连接(ip/数据库用户名/登录密码/数据库名)
        con = connect("localhost", "root", "123456", "web01")
        # 使用 cursor() 方法创建一个游标对象 cursor
        cursors = con.cursor()
        # 使用 execute()  方法执行 SQL 查询 返回的是你影响的行数

        row = cursors.execute("insert into provinces values(%s,%s,%s,%s,%s,%s,%s,%s)",
                              (i.get('id'), i.get('name'), i.get('total').get('confirm'),
                               i.get('total').get('suspect'), i.get('total').get('heal'),
                               i.get('total').get('dead'), i.get('total').get('severe'),
                               i.get('lastUpdateTime')))
        for j in i.get('children'):
            row = cursors.execute("insert into citys values(%s,%s,%s,%s,%s,%s,%s,%s)",
                                  (j.get('id'), j.get('name'), j.get('total').get('confirm'),
                                   j.get('total').get('suspect'), j.get('total').get('heal'),
                                   j.get('total').get('dead'), j.get('total').get('severe'),
                                   j.get('lastUpdateTime')))
        con.commit()  # 提交事务
        con.close()  # 关闭数据库连接

    def run(self):  # 实现主要逻辑
        # 请求数据
        html_str = parse_url(self.url)
        # 获取数据
        content_list = self.getContent_list(html_str)
        values = content_list["areaTree"][0]["children"]
        for i in values:
            self.saveContent_list(i)


if __name__ == '__main__':
    yq = yiqing()
    yq.run()
    print('爬取,存储成功!!')
二.可视化展示
效果如下图:
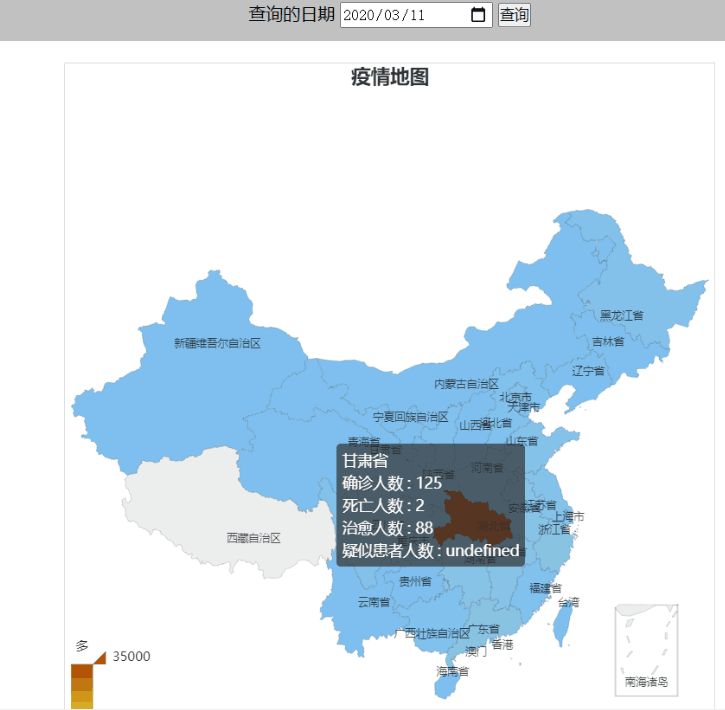
爬取数据后只需将上次的数据查询sql 语句更改一些,并对 Echart 格式进行些许修改即可。
三.学习及实现过程的psp表
| 日期 | 开始时间 | 结束时间 | 中断时间 | 净时间 | 活动 | 备注 |
| 3.10 | 15:35 | 17:35 | 10min | 1h50min | 学习jsoup的使用 |
观看视频进行学习 并对jsoup有了大致了解 |
| 3.11 | 9:50 | 10:50 | 5min | 55min | 亲自实践使用jsoup | 通过视频案例成功爬取了网页图片 |
| 3.11 | 13:30 | 15:30 | 0 | 2h | 用jsoup进行数据爬取 |
网页当中js动态生成的网页无法抓取 找到使用phantomjs 插件的解决方案 对其了解并尝试使用 |
| 3.11 | 16:00 | 17:00 | 0 | 1h | 使用phantomjs插件 |
并未成功爬取到数据 转换思路使用python进行数据爬取 |
| 3.11 | 19:00 | 22:00 | 30min | 2h30min |
学习python基本语法 以及爬取的相关知识 |
使用python抓取数据,并将给出的示例进行改编 成功实现数据存入数据库,并用Echarts可视化展示 |