找了很久才找到一个博客写得比较全面的,FrankDeng
系统环境:CentOS7
相关软件:node-v10.9.0.tar.gz、kibana-6.4.0-linux-x86_64.tar.gz、logstash-6.4.0.zip、elasticsearch-6.4.0.tar.gz,下载地址
先准备三个节点,我这里在每个系统里的/etc/hosts里都添加下了以下内容,在后面的elasticsearch(es)集群的配置里会用到
192.168.133.177 CentOS7-ELk-node21
192.168.133.178 CentOS7-ELk-node22
192.168.133.179 CentOS7-ELk-node23
这里在node21里进行集群的配置
[root@CentOS7-ELk-node21 ~]# grep -v "^#" /opt/module/elk/config/elasticsearch.yml
cluster.name: mycluster
node.name: CentOS7-ELk-node21
bootstrap.memory_lock: false
network.host: 192.168.133.177
discovery.zen.ping.unicast.hosts: ["192.168.133.177", "192.168.133.178", "192.168.133.179"]
discovery.zen.minimum_master_nodes: 2
在node22里进行的配置
[root@CentOS7-ELK-node22 ~]# !grep
grep -v "^#" /opt/module/elk/config/elasticsearch.yml
cluster.name: mycluster
node.name: CentOS7-ELk-node22
network.host: 192.168.133.178
discovery.zen.ping.unicast.hosts: ["192.168.133.177", "192.168.133.178", "192.168.133.179"]
discovery.zen.minimum_master_nodes: 2
在node23里进行的配置
[root@CentOS7-ELK-node23 ~]# !grep
grep -v "^#" /opt/module/elk/config/elasticsearch.yml
cluster.name: mycluster
node.name: CentOS7-ELk-node23
network.host: 192.168.133.179
discovery.zen.ping.unicast.hosts: ["192.168.133.177", "192.168.133.178", "192.168.133.179"]
discovery.zen.minimum_master_nodes: 2
在node22和node23的节点的elasticsearch.yml的文件里将node.name的值改成自动对应的内容然后直接启动es
[root@CentOS7-ELk-node21 ~]# /opt/module/elk/bin/elasticsearch
[root@CentOS7-ELk-node22 ~]# /opt/module/elk/bin/elasticsearch
[root@CentOS7-ELk-node23 ~]# /opt/module/elk/bin/elasticsearch
使用curl命令进行访问看到如下内容说明启动成功
[root@CentOS7-ELk-node21 ~]# curl http://CentOS7-ELk-node21:9200
{
  "name" : "CentOS7-ELk-node21",
  "cluster_name" : "mycluster",
  "cluster_uuid" : "_na_",
  "version" : {
    "number" : "6.4.0",
    "build_flavor" : "default",
    "build_type" : "tar",
    "build_hash" : "595516e",
    "build_date" : "2018-08-17T23:18:47.308994Z",
    "build_snapshot" : false,
    "lucene_version" : "7.4.0",
    "minimum_wire_compatibility_version" : "5.6.0",
    "minimum_index_compatibility_version" : "5.0.0"
  },
  "tagline" : "You Know, for Search"
}
安装个最常用的head插件,下载地址,因为它实际上是一个node.js工作,所以这先来安装个node.js
[root@CentOS7-ELK-node21 ~]# cd /opt/module/node-v10.9.0/
[root@CentOS7-ELK-node21 node-v10.9.0]# ./configure --prefix=/opt/module/node
[root@CentOS7-ELK-node21 node-v10.9.0]# make && make install
经过一次刺激战场经典局鸡屁股的时间。。。
装完成了之后将如下配置添加到/etc/profie里
export NODE_HOME=/opt/module/node
export PATH=$NODE_HOME/bin:$PATH
生效
[root@CentOS7-ELk-node21 node]# source /etc/profile
到elasticsearch-head压缩包所有的目录,解压它后需要安装grunt,先来设置个国内源后再执行
[root@CentOS7-ELk-node21 elasticsearch-head-master]# npm config set registry https://registry.npm.taobao.org
[root@CentOS7-ELk-node21 elasticsearch-head-master]# npm install -g grunt
/opt/module/node/bin/grunt -> /opt/module/node/lib/node_modules/grunt/bin/grunt
+ grunt@1.0.3
added 96 packages from 60 contributors in 5.424s
[root@CentOS7-ELk-node21 elasticsearch-head-master]# npm install
npm WARN deprecated http2@3.3.7: Use the built-in module in node 9.0.0 or newer, instead
npm WARN deprecated coffee-script@1.10.0: CoffeeScript on NPM has moved to "coffeescript" (no hyphen)
> phantomjs-prebuilt@2.1.16 install /usr/local/elasticsearch-head-master/node_modules/phantomjs-prebuilt
> node install.js
PhantomJS not found on PATH
Download already available at /tmp/phantomjs/phantomjs-2.1.1-linux-x86_64.tar.bz2
skipped....
npm WARN notsup SKIPPING OPTIONAL DEPENDENCY: Unsupported platform for fsevents@1.2.4: wanted {"os":"darwin","arch":"any"} (current: {"os":"linux","arch":"x64"})
added 66 packages from 69 contributors in 8.049s
版本确认一下
[root@CentOS7-ELk-node21 elasticsearch-head-master]# node -v
v10.9.0
[root@CentOS7-ELk-node21 elasticsearch-head-master]# npm -v
6.2.0
[root@CentOS7-ELk-node21 elasticsearch-head-master]# grunt -version
grunt-cli v1.2.0
grunt v1.0.1
修改head的源码文件
[root@CentOS7-ELk-node21 elasticsearch-head-master]# vim Gruntfile.js
connect: {
                        server: {
                                options: {
                                        hostname: '0.0.0.0',
                                        port: 9100,
                                        base: '.',
                                        keepalive: true
                                }
                        }
                }
修改es的配置文件
[root@CentOS7-ELk-node21 elk]# tail -2 config/elasticsearch.yml
http.cors.enabled: true
http.cors.allow-origin: "*"
重启es,启动head
[root@CentOS7-ELk-node21 elasticsearch-head-master]# grunt server &
[1] 55189
[root@CentOS7-ELk-node21 elasticsearch-head-master]# (node:55189) ExperimentalWarning: The http2 module is an experimental API.
Running "connect:server" (connect) task
Waiting forever...
Started connect web server on http://localhost:9100
在启动中间会遇到类bootstrap checkd failed的报错,在这个错误下面会有错误的详细信息,常见的有两种
ERROR: [2] bootstrap checks failed
[1]: max file descriptors [4096] for elasticsearch process is too low, increase to at least [65536]

[2]: max virtual memory areas vm.max_map_count [65530] is too low, increase to at least [262144]
解决方案:
编辑 /etc/security/limits.conf,追加以下内容;
* soft nofile 65536
* hard nofile 65536
此文件修改后需要重新登录用户,才会生效
另外一种:
[2]: max virtual memory areas vm.max_map_count [65530] is too low, increase to at least [262144]
解决方案:
编辑 /etc/sysctl.conf,追加以下内容:
vm.max_map_count=655360
保存后,执行:

sysctl -p

重新启动
启动好之后访问node21的9100端口

再来一个bigdesk插件
[root@CentOS7-ELk-node21 local]# wget https://github.com/hlstudio/bigdesk/archive/master.zip
[root@CentOS7-ELk-node21 local]# yum install httpd -y
[root@CentOS7-ELk-node21 local]# systemctl start httpd
[root@CentOS7-ELk-node21 local]# systemctl enable httpd
bigdesk是一个master.zip的包,解压后将它移动到/var/www/html下面即可
[root@CentOS7-ELk-node21 local]# mv bigdesk-master/ /var/www/html/
使用浏览器访问:http://192.168.133.177/bigdesk-master/_site/#nodes
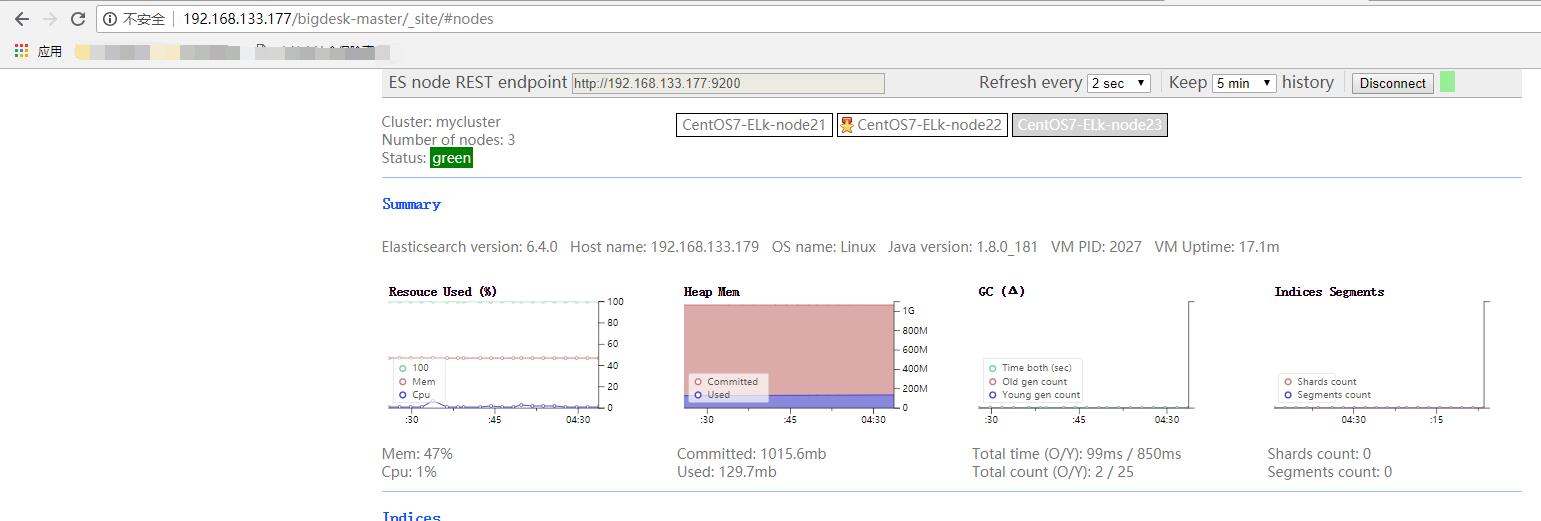
可以说相当好看了,再来一发IK的分词
[root@CentOS7-ELk-node21 local]# mv bigdesk-master/ /var/www/html/
[root@CentOS7-ELk-node21 local]# cd /opt/module/elk/bin/
[root@CentOS7-ELk-node21 bin]# su es
[es@CentOS7-ELk-node21 bin]$ ./elasticsearch-plugin install https://github.com/medcl/elasticsearch-analysis-ik/releases/download/v6.4.0/elasticsearch-analysis-ik-6.4.0.zip
本人在安装的时候第一次出现Exception in thread "main" java.net.ConnectException: Connection refused (Connection refused),可怜我的上进心,再来一次
-> Downloading https://github.com/medcl/elasticsearch-analysis-ik/releases/download/v6.4.0/elasticsearch-analysis-ik-6.4.0.zip
[=================================================] 100%
@@@@@@@@@@@@@@@@@@@@@@@@@@@@@@@@@@@@@@@@@@@@@@@@@@@@@@@@@@@
@     WARNING: plugin requires additional permissions     @
@@@@@@@@@@@@@@@@@@@@@@@@@@@@@@@@@@@@@@@@@@@@@@@@@@@@@@@@@@@
* java.net.SocketPermission * connect,resolve
See http://docs.oracle.com/javase/8/docs/technotes/guides/security/permissions.html
for descriptions of what these permissions allow and the associated risks.

Continue with installation? [y/N]y
-> Installed analysis-ik
重启es后,测试IK,
[es@CentOS7-ELk-node21 bin]$ curl -XPUT http://192.168.133.177:9200/index

logstash的安装
[root@CentOS7-ELk-node21 local]# unzip filebeat-6.4.0-linux-x86_64.tar.gz
[root@CentOS7-ELk-node21 local]# cd logstash-6.4.0
修改logstach的配置文件
[root@CentOS7-ELk-node21 logstash-6.4.0]# vim logstash-simple.conf
input { stdin { } }
output {
  elasticsearch { hosts => ["192.168.133.177:9200"] }
}
一般在企业中,filebeat做为input,然后output到es中,这里得先构建离线插件
[root@CentOS7-ELk-node21 bin]# ./logstash-plugin prepare-offline-pack logstash-input-beats
[root@CentOS7-ELk-node21 bin]# ./logstash-plugin install file:///usr/local/logstash-6.4.0/logstash-offline-plugins-6.4.0.zip
修改配置文件
[root@CentOS7-ELk-node21 config]# vim logstash-sample.conf
input {
  beats {
    port => 5044
  }
}

output {
  elasticsearch {
    hosts => ["http://192.168.133.177:9200"]
    #stdout { codec => rubydebug }
    index => "%{[@metadata][beat]}-%{[@metadata][version]}-%{+YYYY.MM.dd}"
    manage_template => false
    document_type => "%{[@metadata][type]}"
    #user => "elastic"
    #password => "changeme"
  }
}
启动logstash
[root@CentOS7-ELk-node21 logstash-6.4.0]# bin/logstash -f config/logstash-sample.conf &
logstash只是一个日志引擎,日志其实都是通过filebeat上报的,我这里在node22上安装filebeat,解压后进行filebeat目录后,修改配置文件
[root@CentOS7-ELK-node22 filebeat-6.4.0-linux-x86_64]# vim filebeat.yml
- type: log
  enabled: true
  paths:
    - /var/log/nginx/*.log    //如果没有安装nignx的可以这写这一段,这里有设置了上报日志的参数,我的目的只要有日志生成就可以了

- type: log

  # Change to true to enable this input configuration.
  enabled: true

  # Paths that should be crawled and fetched. Glob based paths.
  paths:
    - /var/log/*.log

output.logstash:
  # The Logstash hosts
  hosts: ["192.168.133.177:5044"]    //注意这里
启动filebeat
[root@CentOS7-ELK-node22 filebeat-6.4.0-linux-x86_64]# ./filebeat -e -c filebeat.yml
好的,再安装个kibana,这就全部结束了
[root@CentOS7-ELk-node21 kibana-6.4.0-linux-x86_64]# cd
/usr/local/kibana-6.4.0-linux-x86_64

[root@CentOS7-ELk-node21 kibana-6.4.0-linux-x86_64]# grep -v "^#|^$" config/kibana.yml
server.host: "192.168.133.177"
elasticsearch.url: "http://192.168.133.177:9200"
启动kibana
[root@CentOS7-ELk-node21 kibana-6.4.0-linux-x86_64]# bin/kibana &
看到端口占用5601即可使用浏览器浏览
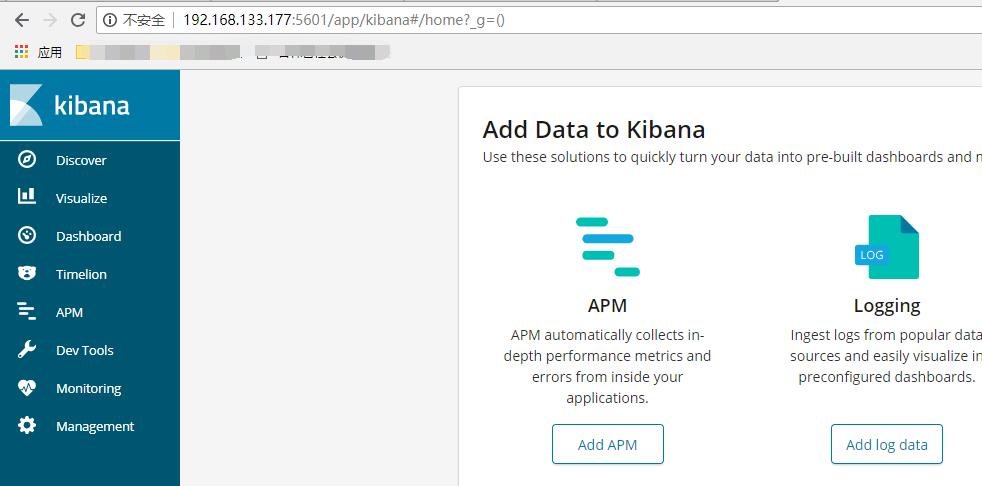
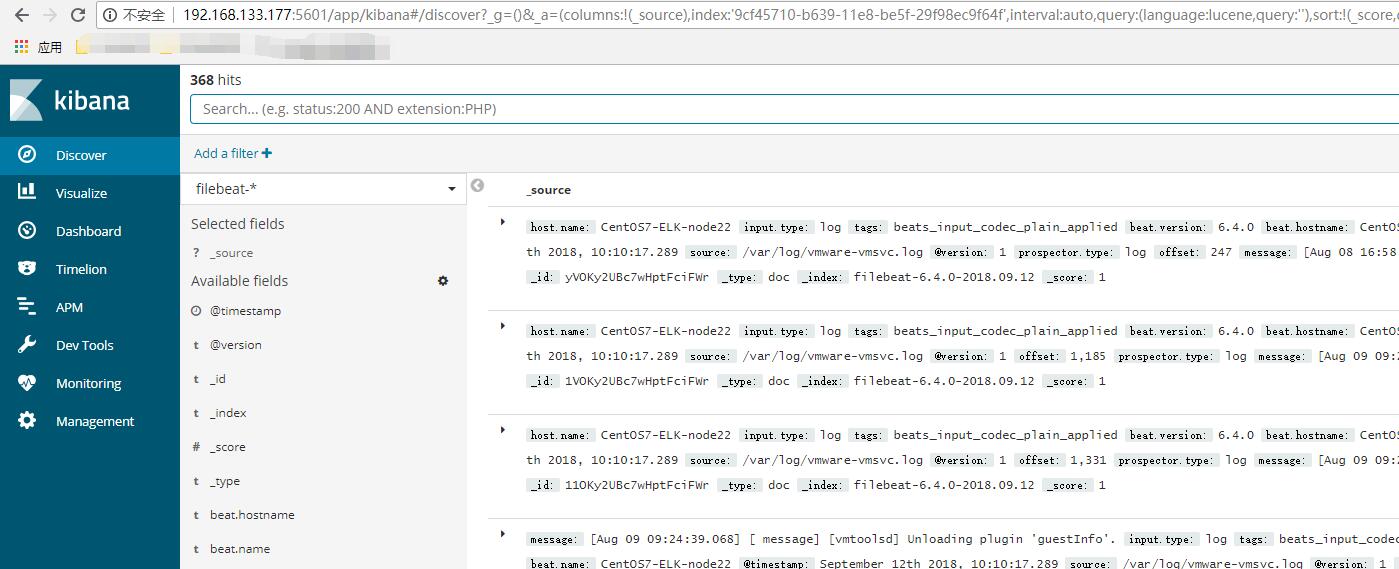
在第一次浏览的时候会要我们设置索引的关键字,在设置栏的下面也会有相应的提示
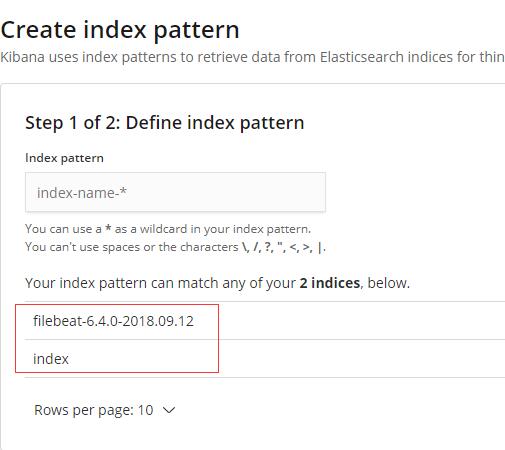
设置好之后再回到Discover的菜单就可以看到你的日志了