neurolab模块相当于Matlab的神经网络工具箱(NNT)
neurolab模块支持的网络类型:
- 单层感知机(single layer perceptron)
- 多层前馈感知机(Multilayer feed forward perceptron)
- 竞争层(Kohonen Layer)
- 学习向量量化(Learning Vector Quantization)
- Elman循环网络(Elman recurrent network)
- Hopfield循环网络(Hopfield recurrent network)
- 卷边循环网络(Hemming recurrent network)
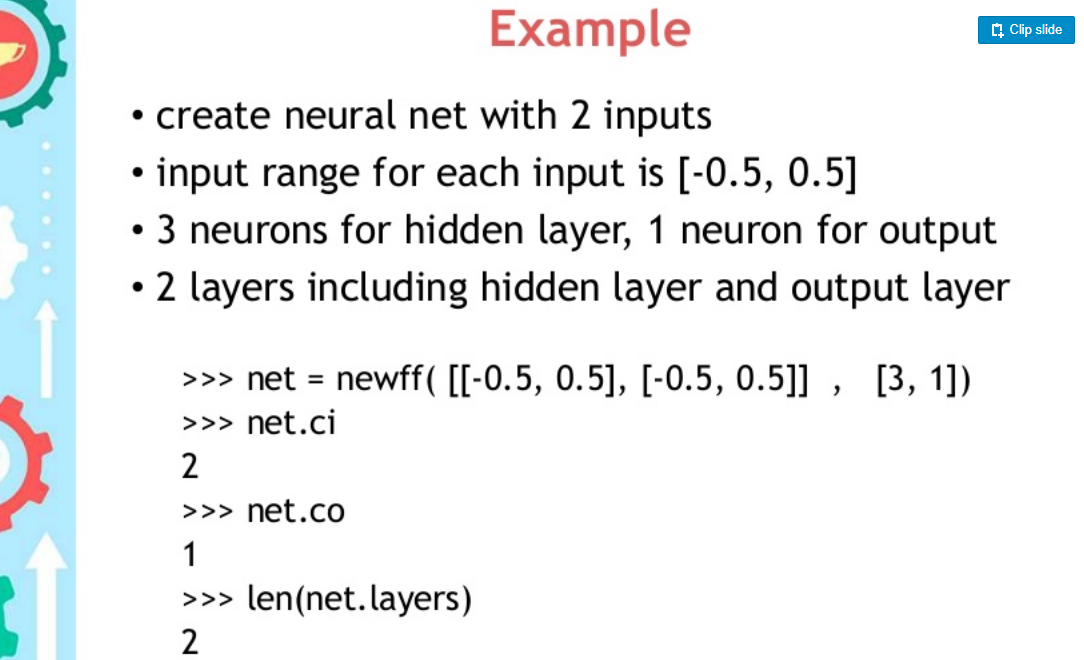
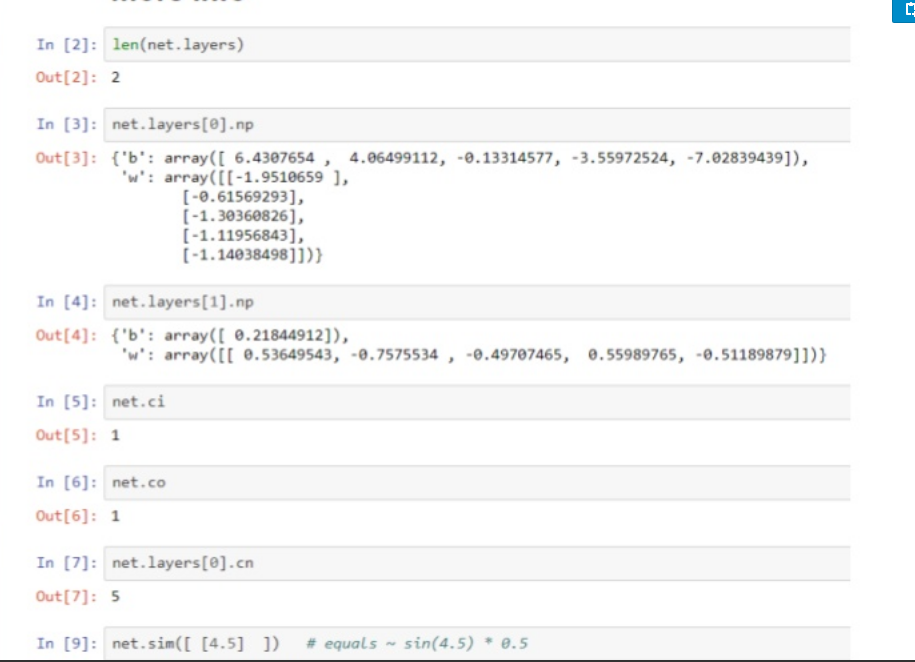
这里以多层前馈网络为例:neurolab.net.newff(minmax, size, transf=None)
| Parameters: |
|
|---|
minmax:列表的列表,外层列表表示输入层的神经元个数,内层列表必须包含两个元素:max和min
size:列表的长度等于出去输入层的网络的层数,列表的元素对应于各层的神经元个数
transf:激活函数,默认为TanSig。
举例2:
perceptron = nl.net.newp([[0, 2],[0, 2]], 1)
第一个参数列表的长度表示输出的节点的个数,列表中得每一个元素包含两个值:最大值和最小值。
第二个参数:The value “1” indicates that there is a single neuron in this network.
error = perceptron.train(input_data, output, epochs=50, show=15, lr=0.01)
epochs:表示迭代训练的次数,show:表示终端输出的频率,lr:表示学习率
举例3:
import numpy as np
import neurolab as nl

input = np.random.uniform(0, 0.1, (1000, 225))
output = input[:,:10] + input[:,10:20]
# 2 layers with 225 inputs 50 neurons in hiddeninput layer and 10 in output
# for 3 layers use some thet: nl.net.newff([[0, .1]]*225, [50, 40, 10])
net = nl.net.newff([[0, .1]]*225, [50, 10])
net.trainf = nl.train.train_bfgs

e = net.train(input, output, show=1, epochs=100, goal=0.0001)
举例4:
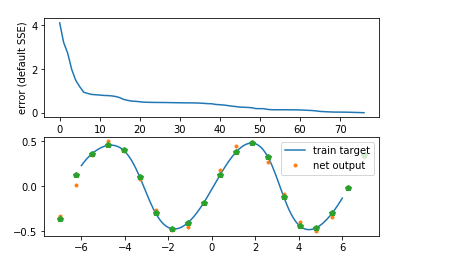
import neurolab as nl
import numpy as np
# Create train samples
x = np.linspace(-7, 7, 20)
y = np.sin(x) * 0.5

size = len(x)

inp = x.reshape(size,1)
tar = y.reshape(size,1)

# Create network with 2 layers and random initialized
net = nl.net.newff([[-7, 7]],[5, 1])

# Train network
error = net.train(inp, tar, epochs=500, show=100, goal=0.02)

# Simulate network
out = net.sim(inp)

# Plot result
import pylab as pl
pl.subplot(211)
pl.plot(error)
pl.xlabel('Epoch number')
pl.ylabel('error (default SSE)')

x2 = np.linspace(-6.0,6.0,150)
y2 = net.sim(x2.reshape(x2.size,1)).reshape(x2.size)
print(len(y2))
y3 = out.reshape(size)
pl.subplot(212)
pl.plot(x2, y2, '-',x , y, '.', x, y3, 'p')
pl.legend(['train target', 'net output'])
pl.show()
资料还有很多,以后继续补充
重点参考:官网
资料