今天写的服务在处理大文件是出现Java heap space错误,因此结识了jmap
jmap是JDK自带的一个工具,可以做jvm性能调优
可以生成dump文件,查询finalize执行队列、Java堆和永久代的详细信息
命令格式
    jmap [option] <pid>
        (to connect to running process)
    jmap [option] <executable <core>
        (to connect to a core file)
    jmap [option] [server_id@]<remote server IP or hostname>
        (to connect to remote debug server)
参数:
option:选项参数,不可同时使用多个选项参数
pid:java进程id,命令ps -ef | grep java获取
executable:产生核心dump的java可执行文件
core:需要打印配置信息的核心文件
remote-hostname-or-ip:远程调试的主机名或ip
server-id:可选的唯一id,如果相同的远程主机上运行了多台调试服务器,用此选项参数标识服务器
<option>
  <none>                to print same info as Solaris pmap
    -heap                to print java heap summary
    -histo[:live]        to print histogram of java object heap; if the "live"
                         suboption is specified, only count live objects
    -clstats             to print class loader statistics
    -finalizerinfo       to print information on objects awaiting finalization
    -dump:<dump-options> to dump java heap in hprof binary format
                         dump-options:
                           live         dump only live objects; if not specified
,
                                        all objects in the heap are dumped.
                           format=b     binary format
                           file=<file>  dump heap to <file>
                         Example: jmap -dump:live,format=b,file=heap.bin <pid>
    -F                   force. Use with -dump:<dump-options> <pid> or -histo
                         to force a heap dump or histogram when <pid> does not
                         respond. The "live" suboption is not supported
                         in this mode.
    -h | -help           to print this help message
    -J<flag>             to pass <flag> directly to the runtime system
说明:
heap : 显示Java堆详细信息
histo : 显示堆中对象的统计信息
permstat :Java堆内存的永久保存区域的类加载器的统计信息
finalizerinfo : 显示在F-Queue队列等待Finalizer线程执行finalizer方法的对象
dump : 生成堆转储快照
F : 当-dump没有响应时,强制生成dump快照
dump : 生成堆转储快照
F : 当-dump没有响应时,强制生成dump快照
eg:
jmap -heap 4924
Attaching to process ID 4924, please wait...
Debugger attached successfully.
Server compiler detected.
JVM version is 25.151-b12

using thread-local object allocation.
Parallel GC with 8 thread(s)

Heap Configuration:
   MinHeapFreeRatio         = 0
   MaxHeapFreeRatio         = 100
   MaxHeapSize              = 4282384384 (4084.0MB)
   NewSize                  = 89128960 (85.0MB)
   MaxNewSize               = 1427111936 (1361.0MB)
   OldSize                  = 179306496 (171.0MB)
   NewRatio                 = 2
   SurvivorRatio            = 8
   MetaspaceSize            = 21807104 (20.796875MB)
   CompressedClassSpaceSize = 1073741824 (1024.0MB)
   MaxMetaspaceSize         = 17592186044415 MB
   G1HeapRegionSize         = 0 (0.0MB)

Heap Usage:
PS Young Generation
Eden Space:
   capacity = 204472320 (195.0MB)
   used     = 56685800 (54.059791564941406MB)
   free     = 147786520 (140.9402084350586MB)
   27.722970033303284% used
From Space:
   capacity = 7340032 (7.0MB)
   used     = 0 (0.0MB)
   free     = 7340032 (7.0MB)
   0.0% used
To Space:
   capacity = 10485760 (10.0MB)
   used     = 0 (0.0MB)
   free     = 10485760 (10.0MB)
   0.0% used
PS Old Generation
   capacity = 170917888 (163.0MB)
   used     = 16323536 (15.567337036132812MB)
   free     = 154594352 (147.4326629638672MB)
   9.550513519099885% used

17780 interned Strings occupying 2312120 bytes.
jmap -dump:live,format=b,file=jmap.log 4924

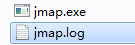
默认路径同jmap.exe在同一目录下
说明:
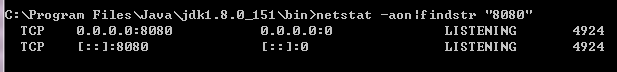
查看pid方法(根据进程端口号查)
netstat -aon|findstr "8080"