Geary's C is a measure of spatial autocorrelation or an attempt to determine if adjacent observations of the same phenomenon are correlated. Geary's C is also known as Geary's contiguity ratio or simply Geary's ratio. While Moran's I measures global spatial autocorrelation, Geary's C is more sensitive to local spatial autocorrelation. Geary's C is related to Moran's I, but it is not identical.
Geary's C is defined as


where xi denotes the observed value at location i, xbar is the mean of the variable x over the n locations and wij are the elements of the spatial weights matrix, defined as 1 if location i is contiguous to location j and 0 otherwise.
Given the null hypothesis is one of no global spatial autocorrelation, the expected value of Geary's C equals 1. As with Moran's I, inference is based on z-scores:
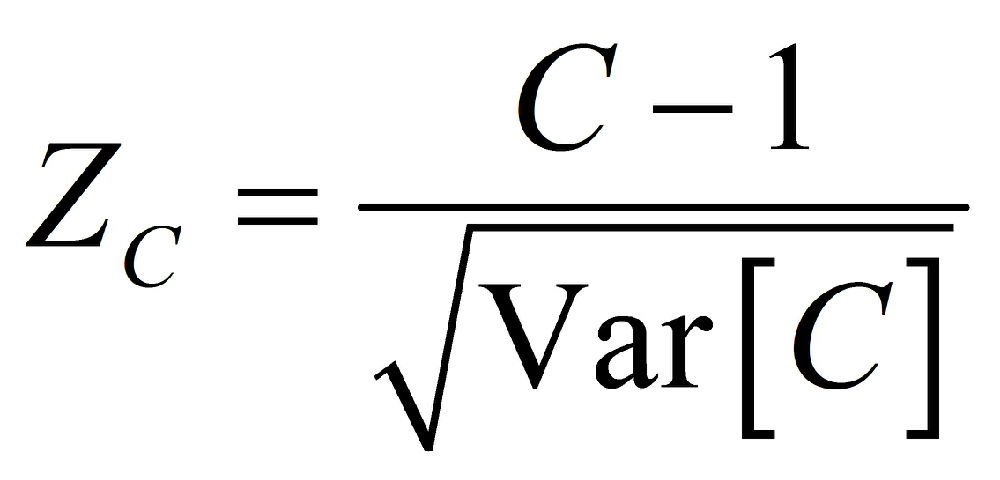

The p-value for the null hypothesis is given as
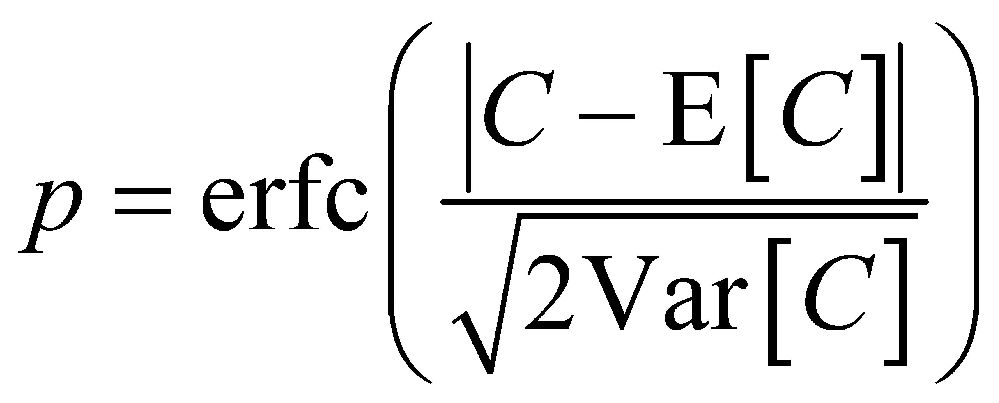
![]()
The value of Geary's C lies between 0 and 2. 1 means no spatial autocorrelation. Values lower than 1 demonstrate increasing positive spatial autocorrelation, whilst values higher than 1 illustrate increasing negative spatial autocorrelation.
Example
以四张NDVI数据为例,代码测试结果如Fig. 1,与SpaceStat返回结果一致。

Fig. 1
References
[1] Moran's I, fromWikipedia, the free encyclopedia.
[2] Geary's C, from Wikipedia, the free encyclopedia.
[3] Global Spatial Autocorrelation Indices - Moran's I, Geary's C and the General Cross-ProductStatistic. (under the normality assumption the variance, the variance under Randomization方差公式存在两种分布假设:正态分布和随机分布)
[4] BioMedware SpaceStat Help - Geary's C Tutorial.
[5] Geary's C – Springer.
[6] Local Spatial Statistics - ENVI.
[7] Geary's C - AURIN.