代码:
option = {
    title: {
        text: '动态数据',
        subtext: '纯属虚构'
    },
    tooltip: {
        trigger: 'axis',
        axisPointer: {
            type: 'cross',
            label: {
                backgroundColor: '#283b56'
            }
        }
    },
    legend: {
        data:['最新成交价', '预购队列', '数据一', '数据二'],
        bottom: 'bottom'
    },
    toolbox: {
        show: true,
        feature: {
            dataView: {readOnly: false},
            restore: {},
            saveAsImage: {}
        }
    },
    dataZoom: {
        show: false,
        start: 0,
        end: 100
    },
    xAxis: [
        {
            type: 'category',
            boundaryGap: true,
            data: (function (){
                var now = new Date();
                var res = [];
                var len = 10;
                while (len--) {
                    res.unshift(now.toLocaleTimeString().replace(/^D*/,''));
                    now = new Date(now - 2000);
                }
                return res;
            })()
        },
        {
            type: 'category',
            boundaryGap: true,
            data: (function (){
                var res = [];
                var len = 10;
                while (len--) {
                    res.push(10 - len - 1);
                }
                return res;
            })()
        }
    ],
    yAxis: [
        {
            type: 'value',
            scale: true,
            name: '价格',
            max: 30,
            min: 0,
            boundaryGap: [0.2, 0.2]
        },
        {
            type: 'value',
            scale: true,
            name: '预购量',
            max: 1200,
            min: 0,
            boundaryGap: [0.2, 0.2]
        }
    ],
    color: ['#CE0000', '#FFD0FF', '#FF8F59', '#272727'],
    series: [
        {
            name: '预购队列',
            type: 'bar',
            xAxisIndex: 1,
            yAxisIndex: 1,
            barWidth: '30%',
            data: (function (){
                var res = [];
                var len = 10;
                while (len--) {
                    res.push(Math.round(Math.random() * 300));
                }
                return res;
            })(),
            markPoint: {
                symbol: 'circle',
                symbolSize: 50,
                symbolOffset: [0, -40],
                itemStyle: {
                    color: '#EAC100'
                },
                data: [
                    {type: 'max', name: '最大值'},
                    {type: 'min', name: '最小值'},
                ]
            },
        },
        {
            name: '最新成交价',
            type: 'line',
            symbol: 'none',
            lineStyle: {
                type: 'solid',
                 2,
                // color: 'black',
            },
            data: (function (){
                var res = [];
                var len = 0;
                while (len < 10) {
                    res.push((Math.random()*10 + 5).toFixed(1) - 0);
                    len++;
                }
                return res;
            })()
        },
        {
            name: '数据一',
            type: 'line',
            symbol: 'none',
            lineStyle: {
                type: 'dashed',
                 2,
                // color: 'orange',
            },
            data: (function (){
                var res = [];
                var len = 0;
                while (len < 10) {
                    res.push((Math.random()*10 + 5).toFixed(1) - 0);
                    len++;
                }
                return res;
            })()
        },
        {
            name: '数据二',
            type: 'line',
            symbol: 'none',
            lineStyle: {
                type: 'dashed',
                 2,
                // color: 'red',
            },
            data: (function (){
                var res = [];
                var len = 0;
                while (len < 10) {
                    res.push((Math.random()*10 + 5).toFixed(1) - 0);
                    len++;
                }
                return res;
            })()
        }
    ]
};


myChart.setOption(option);
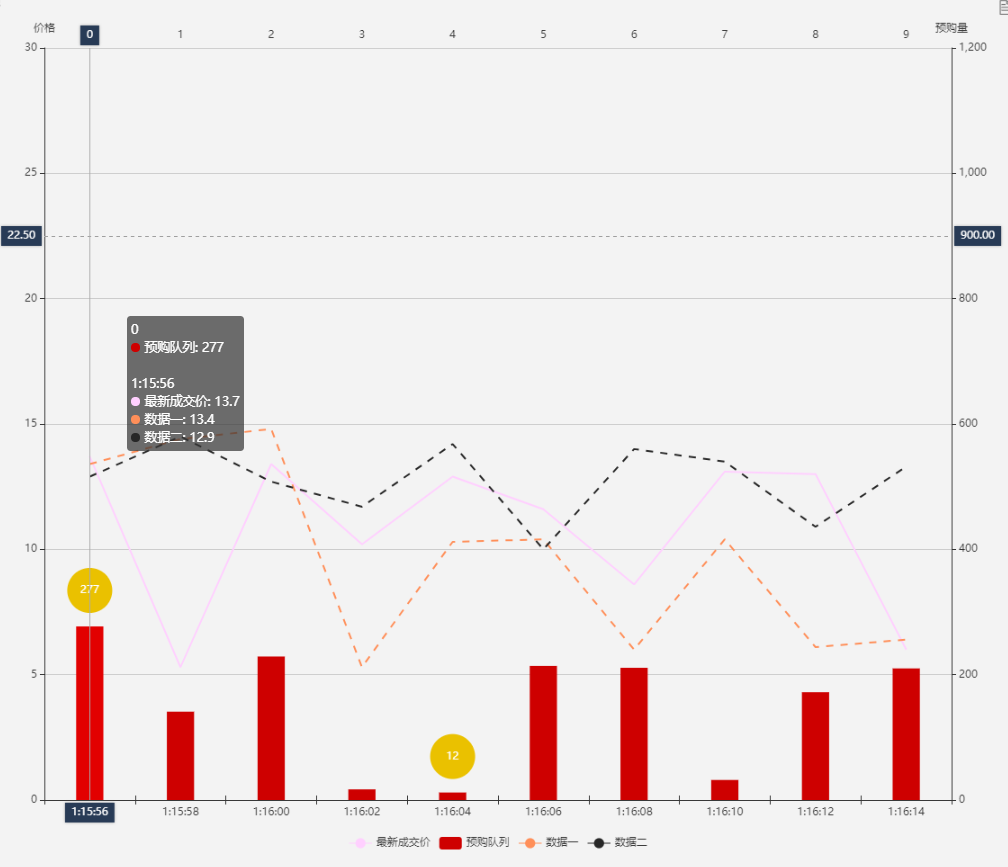
效果: