关键词:Illegal Instruction、SIGILL等。
进程在运行过程中会收到SIGILL信号,此类错误是由操作系统发送给进程的。
SIGILL是某个进程中的某一句不能被CPU识别指令,这些指令可能是一些形式错误、未知或者特权指令。
1. SIGILL原因
1.1 错误修改代码段
进程代码段中数据是作为指令运行的,如果不小心代码段被错误覆盖,那么CPU可能无法识别对应的代码,进而造成Illegal Instruction。
同样,如果栈被不小心覆盖了,造成返回地址错误、CPU跳转到错误地址,执行没有意义的内存数据,进而造成Illegal Instruction。
进一步可以认为,任何导致代码段错误的问题都可能带来Illegal Instruction。
1.2 指令集演进
CPU的指令集在不停演进,如果将较新指令集版本的程序在老版本CPU上运行,则老版本CPU运行时会有Illegal Instruction问题。
1.3 工具链Bug
编译器(汇编器或者连接器)自身的bug,有可能生成CPU无法识别的指令。
1.4 内存访问对齐或浮点格式问题
出现错误的指令可能和访存地址指令有关。 另外,浮点数的格式是否符合IEEE的标准也可能会有影响。
2. 错误排查指南
-
程序中有没有特权指令、或者访问特权寄存器
-
有没有将在较新CPU上编译得到的可执行文件拿到老CPU上运行------------这种问题是100%复现,只需要查看对应汇编程序即可知道大概。
-
程序中有没有嵌入式汇编,先检查。-------------------------------------------------编译器bug。
-
一般编译器很少会生成有这种问题的代码
-
X86平台上要尤其注意64位汇编指令和32位汇编指令的混用问题
-
-
程序有在进程代码段空间写数据的机会吗?----------------------------------------下面的分析就是代码段被非法修改。还可能是意见存在问题,DDR中数据正确,从DDR读取的数据经过总线产生数据突变异常。
-
栈操作够安全吗?--------------------------------------------------------------------------如果异常PC指向栈,那么即是栈被非法修改。
-
注意程序的ABI是否正确------------------------------------------------------------------100%复现问题,只需要检查ABI说明书即可。
-
尤其是动态链和静态链是否处理的正确,尽量避免动态链的可执行文件调用错误库的问题(ARM的EABI,MIPS的N32/O32/N64都很可能出这种问题)
-
-
用的工具链靠谱吗?
3. Illegal Instruction处理
CK异常向量VEC_ILLEGAL对应非法指令错误,出现问题的时候内核输出“Illegal instruction Error”,然后输出寄存去、相关代码段、栈等信息;最后发送SIGILL信号给进程。
asmlinkage void trap_c(struct pt_regs *regs)
{
    int sig;
    unsigned long vector;
    siginfo_t info;

    vector = (mfcr("psr") >> 16) & 0xff;

    switch (vector) {
...
        case VEC_ILLEGAL:
#ifndef CONFIG_CPU_NO_USER_BKPT
        if (*(uint16_t *)instruction_pointer(regs) != 0x1464)
#endif
        {
            sig = SIGILL;
            pr_err("Illegal instruction Error
");
            show_regs(regs);
            break;
        }
...
    }
    send_sig(sig, current, 0);---------------------------------------------发送SIGILL给当前进程。
}

void show_regs(struct pt_regs *fp)
{
    unsigned long   *sp;
    unsigned char   *tp;
    int    i;

    pr_info("
CURRENT PROCESS:

");
    pr_info("COMM=%s PID=%d
", current->comm, current->pid);

    if (current->mm) {
        pr_info("TEXT=%08x-%08x DATA=%08x-%08x BSS=%08x-%08x
",
               (int) current->mm->start_code,
               (int) current->mm->end_code,
               (int) current->mm->start_data,
               (int) current->mm->end_data,
               (int) current->mm->end_data,
               (int) current->mm->brk);
        pr_info("USER-STACK=%08x  KERNEL-STACK=%08x

",
               (int) current->mm->start_stack,
               (int) (((unsigned long) current) + 2 * PAGE_SIZE));
    }

    pr_info("PC: 0x%08lx (%pS)
", (long)fp->pc, (void *)fp->pc);
    pr_info("LR: 0x%08lx (%pS)
", (long)fp->lr, (void *)fp->lr);
    pr_info("SP: 0x%08lx
", (long)fp);
    pr_info("orig_a0: 0x%08lx
", fp->orig_a0);
    pr_info("PSR: 0x%08lx
", (long)fp->sr);

    pr_info(" a0: 0x%08lx   a1: 0x%08lx   a2: 0x%08lx   a3: 0x%08lx
",
           fp->a0, fp->a1, fp->a2, fp->a3);
#if defined(__CSKYABIV2__)
    pr_info(" r4: 0x%08lx   r5: 0x%08lx   r6: 0x%08lx   r7: 0x%08lx
",
           fp->regs[0], fp->regs[1], fp->regs[2], fp->regs[3]);
    pr_info(" r8: 0x%08lx   r9: 0x%08lx  r10: 0x%08lx  r11: 0x%08lx
",
           fp->regs[4], fp->regs[5], fp->regs[6], fp->regs[7]);
    pr_info("r12: 0x%08lx  r13: 0x%08lx  r15: 0x%08lx
",
           fp->regs[8], fp->regs[9], fp->lr);
    pr_info("r16: 0x%08lx  r17: 0x%08lx  r18: 0x%08lx  r19: 0x%08lx
",
           fp->exregs[0], fp->exregs[1], fp->exregs[2], fp->exregs[3]);
    pr_info("r20: 0x%08lx  r21: 0x%08lx  r22: 0x%08lx  r23: 0x%08lx
",
           fp->exregs[4], fp->exregs[5], fp->exregs[6], fp->exregs[7]);
    pr_info("r24: 0x%08lx  r25: 0x%08lx  r26: 0x%08lx  r27: 0x%08lx
",
           fp->exregs[8], fp->exregs[9], fp->exregs[10], fp->exregs[11]);
    pr_info("r28: 0x%08lx  r29: 0x%08lx  r30: 0x%08lx  tls: 0x%08lx
",
           fp->exregs[12], fp->exregs[13], fp->exregs[14], fp->tls);
    pr_info(" hi: 0x%08lx   lo: 0x%08lx
",
           fp->rhi, fp->rlo);
#else
    pr_info(" r6: 0x%08lx   r7: 0x%08lx   r8: 0x%08lx   r9: 0x%08lx
",
           fp->regs[0], fp->regs[1], fp->regs[2], fp->regs[3]);
    pr_info("r10: 0x%08lx  r11: 0x%08lx  r12: 0x%08lx  r13: 0x%08lx
",
           fp->regs[4], fp->regs[5], fp->regs[6], fp->regs[7]);
    pr_info("r14: 0x%08lx   r1: 0x%08lx  r15: 0x%08lx
",
           fp->regs[8], fp->regs[9], fp->lr);
#endif

    pr_info("
CODE:");---------------------------------------------------------------加大dump的代码段范围,确认覆盖范围是多少?
    tp = ((unsigned char *) fp->pc) - 0x40;
    tp += ((int)tp % 4) ? 2 : 0;
    for (sp = (unsigned long *) tp, i = 0; (i < 0xc0);  i += 4) {
        if ((i % 0x10) == 0)
            pr_cont("
%08x: ", (int) (tp + i));
        pr_cont("%08x ", (int) *sp++);
    }
    pr_cont("
");

    pr_info("
KERNEL STACK:");
    tp = ((unsigned char *) fp) - 0x40;
    for (sp = (unsigned long *) tp, i = 0; (i < 0xc0); i += 4) {
        if ((i % 0x10) == 0)
            pr_cont("
%08x: ", (int) (tp + i));
        pr_cont("%08x ", (int) *sp++);
    }
    pr_cont("
");

    show_stack(NULL, (unsigned long *)fp->regs[4]);
    return;
}
4. Illegal Instruction问题分析(位于Kernel)
Illegal Instruction输出如下:
[ 2343.202217] Illegal instruction Error
[ 2343.205883]
[ 2343.205883] CURRENT PROCESS:
[ 2343.205883]
[ 2343.211728] COMM=syslogd PID=135-----------------------------------发生错误进程的信息,代码数据段。
[ 2343.214963] TEXT=00008000-000c68cc DATA=000c7f1c-000c8175 BSS=000c8175-000ea000
[ 2343.222278] USER-STACK=7f89ae80  KERNEL-STACK=be826580
[ 2343.222278]
[ 2343.228906] PC: 0x805397de (__skb_try_recv_datagram+0x4e/0x2d8)----0x80000000以上的地址表示内核空间。
[ 2343.234837] LR: 0x805ce90e (unix_dgram_recvmsg+0xa2/0x56c)
[ 2343.240327] SP: 0xbe82bd1c
[ 2343.243124] orig_a0: 0xbf3b2400
[ 2343.246269] PSR: 0x80040340
[ 2343.249070]  a0: 0xbf3b2400   a1: 0x00000000   a2: 0xbe82bdb8   a3: 0x00000000
[ 2343.256301]  r4: 0xbe82be0c   r5: 0xbf3b2400   r6: 0xbe82be14   r7: 0xbe82be14
[ 2343.263531]  r8: 0xbe82bdbc   r9: 0xbe82be08  r10: 0xbe82be04  r11: 0x00000000
[ 2343.270761] r12: 0x80100340  r13: 0x805397c0  r15: 0x805ce90e
[ 2343.276514] r16: 0xbe82be04  r17: 0xbe82be10  r18: 0xbe8245b4  r19: 0x0000003b
[ 2343.283745] r20: 0x00000000  r21: 0x00000000  r22: 0x00000038  r23: 0x2dc2ae38
[ 2343.290974] r24: 0xbf3b2454  r25: 0x00000001  r26: 0x8004f940  r27: 0x000000ff
[ 2343.298204] r28: 0x2abf5000  r29: 0x00000000  r30: 0x00000000  tls: 0x00000001
[ 2343.305433]  hi: 0x007838aa   lo: 0x33ee4b1f
[ 2343.309793]
CODE:------------------------------------------------------------------PC指向的代码段,非法指令即在此处。发生在内核的地址比较固定。如果在用户空间,则需要代码段映射的其实地址。
805397c0: 4820c400 4831c402 e4486dcf d8681003
805397d0: b260200b 2040d860 da086d43 e560200c
805397e0: e923fe53 e4610403 e4480040 e5210107
805397f0: b2602002 20001047 20002070 6026d900
[ 2343.328840]
KERNEL STACK:
be82bcdc: be82bcdc 808fec04 00000004 00000001
be82bcec: 000c8175 000ea000 be82bd10 8004b002
be82bcfc: be82bd1c bf3b2400 be82be14 be82be14
be82bd0c: be82be08 be82bdbc 8004a418 be82be0c
be82bd1c: 00000001 805ce90e 805397de 80040340
be82bd2c: 2df4eaf0 bf3b2400 bf3b2400 00000000
be82bd3c: be82bdb8 00000000 be82be0c bf3b2400
be82bd4c: be82be14 be82be14 be82bdbc be82be08
be82bd5c: be82be04 00000000 80100340 805397c0
be82bd6c: be82be04 be82be10 be8245b4 0000003b
be82bd7c: 00000000 00000000 00000038 2dc2ae38
be82bd8c: bf3b2454 00000001 8004f940 000000ff
[ 2343.382450]
Call Trace:
[<805ce90e>] unix_dgram_recvmsg+0xa2/0x56c
[<8052b6f0>] sock_recvmsg+0x40/0x50
[<8052b786>] sock_read_iter+0x86/0xac
[<80134de8>] __vfs_read+0xc0/0x108
[<80135c14>] vfs_read+0x94/0x128
[<80136d12>] SyS_read+0x52/0xd4
[<8004a246>] csky_systemcall+0x96/0xe0
地址0x805397c0通过csky-abiv2-linux-objudmp -D -S vmlinux之后,如下:
80539790 <__skb_try_recv_datagram>:
...
805397c0:       c4004820        lsli            r0, r0, 0
805397c4:       c4024831        lsli            r17, r2, 0
805397c8:       6dcf            mov             r7, r3
805397ca:       e4481003        subi            r2, r8, 4
805397ce:       d868200b        ld.w            r3, (r8, 0x2c)
805397d2:       b260            st.w            r3, (r2, 0)
805397d4:       d8602040        ld.w            r3, (r0, 0x100)
805397d8:       6d43            mov             r5, r0
805397da:       da08200c        ld.w            r16, (r8, 0x30)
805397de:       e5600053        addi            r11, r0, 84-----------------------------非法指令异常现场。
805397e2:       e9230103        bnez            r3, 0x805399e8  // 805399e8 <_end+0xffb857e8>
805397e6:       e4612040        andi            r3, r1, 64
805397ea:       e4481007        subi            r2, r8, 8
805397ee:       e5212002        andi            r9, r1, 2
805397f2:       b260            st.w            r3, (r2, 0)
805397f4:       d9472000        ld.w            r10, (r7, 0)
805397f8:       dd702000        st.w            r11, (r16, 0)
805397fc:       c0006026        mfcr            r6, cr<0, 0>
...
将log dump出来的代码段按照objdump顺序排列如下,可以看出红色加粗部分的不一致:
c4004820
c4024831
6dcf
e4481003
d868200b
b260
d8602040
6d43
da08200c
e560fe53-------------------------------------------------------------------------------PC指向的异常代码点。
e9230403
e4610040
e4480107
e5212002
b260
10472000
20702000
d9006026
然后在对log dump数据按照地址排列,可以发现红色加粗部分存在一定规律:突变的8bit位置固定。
805397c0: 4820c400 4831c402 e4486dcf d8681003
805397d0: b260200b 2040d860 da086d43 e560200c
805397e0: e923fe53 e4610403 e4480040 e5210107
805397f0: b2602002 20001047 20002070 6026d900
可以看出从DDR到CPU的数据明显的出错规律。
这种类型的错误不像是上面错误排查里面的任一种,而类似硬件异常导致的。
4. Illegal Instruction问题定位(位于userspace)
4.1 用户空间代码段定位
需要对SIGILL进行处理,打印bin代码段以及库代码段。
signal(SIGILL,sigillDeal);----------------------------------注册SIGILL对应的处理函数

void sigillDeal(int sig)
{
  if(sig == SIGILL)
  {
    printf("
Got SIGILL(Illegal Instruction)
");
    system("cat /proc/`pidof AiApp`/maps");-----------------获取进程的maps信息。
    raise(SIGSEGV);-----------------------------------------将当前进程的内存存入coredump中,便于后续通过gdb分析导出内存内容。
  }
}
如果内核产生SIGILL信号,用户空间收到信号就会记录当前进程maps,并且将进程内存保存到core中。
后面再core中可以使用dump memory到处代码段和bin文件进行对比。
dump memory app.bin 0x8000 0x590000
可以通过hexdump将app.bin和对应代码段对比。
4.2 hexdump对比进程内存和代码段
bin文件和库文件都通过mmap到进程的地址空间,在进程的/proc/xxx/map_files中存在一地址范围为名称的文件。
通过hexdump读取这些文件,可以知道文件在内存中的值。
然后和对应的bin、库文件对比即可。
lr--------    1 root     root          64 Jan  1 08:17 2aaa8000-2aac5000 -> /lib/ld-2.28.9000.so
lr--------    1 root     root          64 Jan  1 08:17 2aac5000-2aac6000 -> /lib/ld-2.28.9000.so
lr--------    1 root     root          64 Jan  1 08:17 2aac6000-2aac7000 -> /lib/ld-2.28.9000.so
lr--------    1 root     root          64 Jan  1 08:17 2aaca000-2aacb000 -> /usr/lib/libtestdevice.so
lr--------    1 root     root          64 Jan  1 08:17 2aacb000-2aacc000 -> /usr/lib/libtestdevice.so
lr--------    1 root     root          64 Jan  1 08:17 2aacc000-2aacd000 -> /usr/lib/libtestdevice.so
具体地址范围对应的是代码段还是数据段可以通过/proc/xxx/maps获取:
2aaa8000-2aac5000 r-xp 00000000 b3:01 524478     /lib/ld-2.28.9000.so
2aac5000-2aac6000 r--p 0001c000 b3:01 524478     /lib/ld-2.28.9000.so
2aac6000-2aac7000 rw-p 0001d000 b3:01 524478     /lib/ld-2.28.9000.so
2aac7000-2aac8000 r-xp 00000000 00:00 0          [vdso]
2aac8000-2aaca000 rw-p 00000000 00:00 0
2aaca000-2aacb000 r-xp 00000000 b3:01 1180187    /usr/lib/libtestdevice.so
2aacb000-2aacc000 r--p 00000000 b3:01 1180187    /usr/lib/libtestdevice.so
2aacc000-2aacd000 rw-p 00001000 b3:01 1180187    /usr/lib/libtestdevice.so
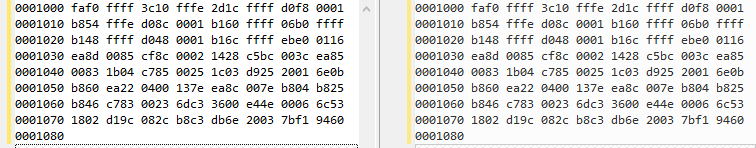
hexdump 2aaa8000-2aac5000 -n 128 -s 4096和hexdump ld-2.28.9000.so -n 128 -s 4096结果对比如下:
参考文档:《Illegal Instruction错误小谈》