1. 启动 IPython

2.
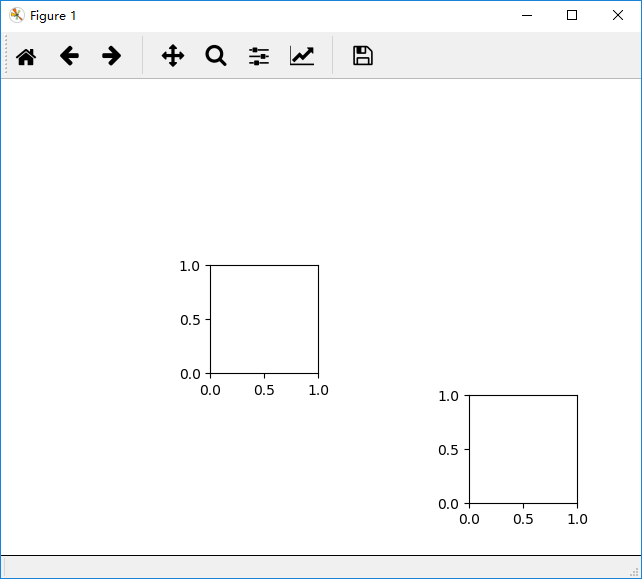
>> fig = plt.figure()
>> ax1 = fig.add_subplot(346) # 将画布分割成3行4列,图像画在从左到右从上到下的第6块
>> ax2 = fig.add_subplot(3,4,12)
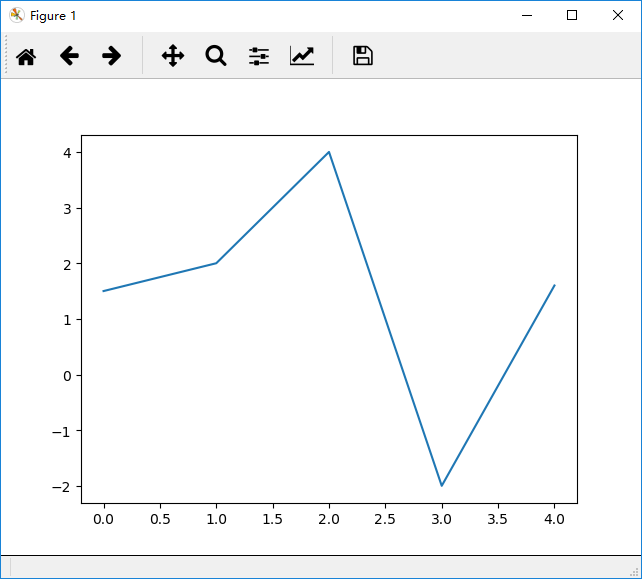
3. 绘制几个点连接
>> plt.plot([1.5, 2, 4, -2, 1.6])
1. 启动 IPython
2.
>> fig = plt.figure()
>> ax1 = fig.add_subplot(346) # 将画布分割成3行4列,图像画在从左到右从上到下的第6块
>> ax2 = fig.add_subplot(3,4,12)
3. 绘制几个点连接
>> plt.plot([1.5, 2, 4, -2, 1.6])