具体的实现请看代码详情
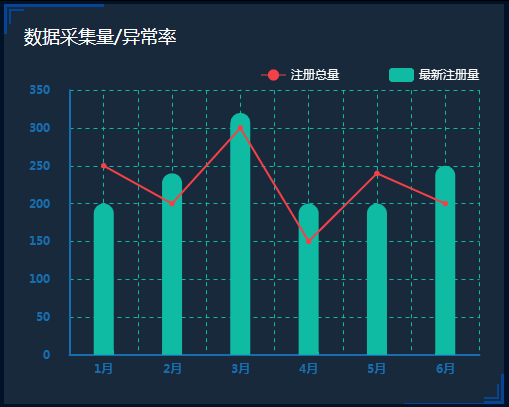
效果图:
demo:
<template>
<div>
<div class="title">数据采集量/异常率</div>
<div id="myChart"></div>
</div>
</template>
<script>
export default {
name: 'data-acquisition',
data () {},
mounted () {
this.drawLine()
},
methods: {
drawLine () {
let echarts = require('echarts')
// 基于准备好的dom,初始化echarts实例
var myChart = echarts.init(document.getElementById('myChart'))
// 绘制图表
let option = {
backgroundColor: '#19293C',
tooltip: {},
grid: {
top: '8%',
left: '1%',
right: '1%',
bottom: '8%',
containLabel: true
},
legend: {
itemGap: 50,
data: ['注册总量', '最新注册量'],
textStyle: {
color: '#f9f9f9',
borderColor: '#F44147'
},
left: 'right'
},
xAxis: [{
type: 'category',
boundaryGap: true,
splitLine: { // 设置网格
show: true,
lineStyle: {
type: 'dashed',
color: '#10BBA3'
}
},
axisLine: { // 坐标轴轴线相关设置。数学上的x轴
show: true,
lineStyle: {
color: '#186DAF',
2 // 粗细
}
},
axisLabel: { // 坐标轴刻度标签的相关设置
textStyle: {
color: '#186DAF', // 字体颜色
margin: 15,
fontWeight: 'bolder' // 字体加粗
}
},
axisTick: { // 与x轴刻度对齐,并设置高度和网格
show: true,
alignWithLabel: true, // x轴刻度对齐
inside: true, // x轴内侧
length: 265,
lineStyle: {
type: 'dashed', // 虚线
color: '#10BBA3' // 颜色
}
},
data: [ '1月', '2月', '3月', '4月', '5月', '6月' ]
}],
yAxis: [{
type: 'value',
min: 0,
splitNumber: 7,
splitLine: { // 设置网格
show: true, // 是否显示轴
lineStyle: {
type: 'dashed', // 虚线
color: '#10BBA3' // 颜色
}
},
axisLine: { // 坐标轴轴线相关设置。数学上的x轴
show: true,
lineStyle: {
color: '#186DAF',
2 // 粗细
}
},
axisLabel: {
margin: 20,
textStyle: {
fontWeight: 'bolder',
color: '#186DAF'
}
},
axisTick: {
show: false
}
}],
series: [{
name: '注册总量',
type: 'line',
showAllSymbol: true,
symbol: 'circle', // 默认是空心圆(中间是白色的),改成实心圆
symbolSize: 4, // 默认园的大小
itemStyle: {
normal: {
color: '#F44147', // 会设置点和线的颜色,所以需要下面定制 line
borderColor: '#F44147' // 点边线的颜色
}
},
lineStyle: {
normal: {
color: '#F44147',
lineStyle: {
color: '#F44147'
}
}
},
label: {
show: false,
position: 'top',
textStyle: {
color: '#fff'
}
},
tooltip: {
show: false
},
// areaStyle: { // 区域填充样式
// normal: {
// // 线性渐变,前4个参数分别是x0,y0,x2,y2(范围0~1);相当于图形包围盒中的百分比。如果最后一个参数是‘true’,则该四个值是绝对像素位置。
// color: new echarts.graphic.LinearGradient(0, 0, 0, 1, [{
// offset: 0,
// color: 'rgba(0,154,120,1)'
// },
// {
// offset: 1,
// color: 'rgba(0,0,0, 0)'
// }
// ], false),
// shadowColor: 'rgba(53,142,215, 0.9)', // 阴影颜色
// shadowBlur: 20 // shadowBlur设图形阴影的模糊大小。配合shadowColor,shadowOffsetX/Y, 设置图形的阴影效果。
// }
// },
data: [250, 200, 300, 150, 240, 200]
}, {
name: '最新注册量',
type: 'bar',
barWidth: 20,
tooltip: {
show: false
},
label: {
show: false,
position: 'top',
textStyle: {
color: '#fff'
}
},
itemStyle: {
normal: {
barBorderRadius: [ 10, 10, 0, 0 ], // 柱形图圆角,初始化效果
color: function (params) {
var colorList = ['#10BBA3', '#10BBA3', '#10BBA3', '#10BBA3', '#10BBA3', '#10BBA3', '#10BBA3']
return colorList[params.dataIndex]
}
}
},
data: [200, 240, 320, 200, 200, 250]
}]
}
myChart.setOption(option)
}
}
}
</script>
<style scoped>
#myChart{
margin: 15px;
height: 340px;
460px;
background: #fff;
}
.title{
margin: 15px;
font-family: 微软雅黑;
font-size: 18px;
color: #fff;
}
</style>