1.1 系统环境
[root@localhost ~]# cat /etc/os-release

NAME="CentOS Linux"

VERSION="7 (Core)"

ID="centos"

ID_LIKE="rhel fedora"

VERSION_ID="7"

PRETTY_NAME="CentOS Linux 7 (Core)"

ANSI_COLOR="0;31"

CPE_NAME="cpe:/o:centos:centos:7"

HOME_URL="https://www.centos.org/"

BUG_REPORT_URL=https://bugs.centos.org/
主机名设置
hostnamectl set-hostname elk

[root@elk ~]# hostnamectl

   Static hostname: elk

         Icon name: computer-vm

           Chassis: vm

        Machine ID: d1d80bc30b414ba7a6e5e49906699d7d

           Boot ID: 49488ed1b1434c8aa06fca343bf67ccf

    Virtualization: vmware

  Operating System: CentOS Linux 7 (Core)

       CPE OS Name: cpe:/o:centos:centos:7

            Kernel: Linux 3.10.0-693.el7.x86_64

      Architecture: x86-64
系统ip
[root@elk ~]# ip  a s ens33

2: ens33: <BROADCAST,MULTICAST,UP,LOWER_UP> mtu 1500 qdisc pfifo_fast state UP qlen 1000

    link/ether 00:0c:29:32:12:d0 brd ff:ff:ff:ff:ff:ff

    inet 10.0.0.11/24 brd 10.0.0.255 scope global ens33

       valid_lft forever preferred_lft forever

    inet6 fe80::a7f2:2fd2:eb18:3361/64 scope link

       valid_lft forever preferred_lft forever
1.2 常用软件安装及设置
rm -rf /var/cache/yum/*

curl -o /etc/yum.repos.d/epel.repo http://mirrors.aliyun.com/repo/epel-7.repo

curl -o /etc/yum.repos.d/CentOS-Base.repo http://mirrors.aliyun.com/repo/Centos-7.repo

yum install -y wget tree lrzsz vim bash-completion
关闭防火墙及selinux
systemctl disable firewalld

systemctl stop firewalld

vi /etc/selinux/config
...
SELINUX=disabled
...

setenforce 0
2.ELK介绍
2.1 elasticsearch
2.1.1 elasticsearch介绍
Elasticsearch是基于Lucene的搜索服务器。它提供了一个分布式多用户能力的全文检索引擎,基于 RESTful web接口。Elasticsearch是用java开发的,并作为Apache许可条款下的开放源码发布,是第二流行的企业搜索引擎。设计用于云计算中,能够达到实时搜索,稳定,可靠,快速,安装使用方便。
2.1.2 elasticsearch几个重要术语
NRT
elasticsearch是一个近似实时的搜索平台,从索引文档到可搜索有些延迟,通常为1秒。
集群
集群就是一个或多个节点存储数据,其中一个节点为主节点,这个主节点是可以通过选举产生的,并提供跨节点的联合索引和搜索功能。集群有一个唯一标志的名字,默认是elasticsearch,集群名字很重要,每个节点都是基于名字加入到集群中的。因此,确保在不同环境中使用不同的集群名字。一个集群可以只有一个节点。强烈建议在配置elasticsearch时,配置成集群模式。
节点
节点就是一台单独的服务器,是集群的一部分,存储数据关参与集群的索引和搜索功能。像集群一样,节点通过名字来标识,默认在节点启动时随机分配的字符名。当然啦,你可以自己定义。该名字也蛮重要的,在集群中用于识别服务器对应的节点。
节点可以通过指定集群名字来加入到集群中。默认情况下,每个节点被设置成加入elasticsearch集群。如果启动多个节点,假设能自动发现对方,他们将会自动组建一个名为elasticsearch的集群。
索引
索引是几分相似属性的文档集合。比如nginx日志索引,syslog索引等。索引是由名字标识,名字必须全部小写。这个名字用来进行索引,搜索,更新和删除文档的操作。
索引相对于关系型数据库的库
类型
在一个索引中,可以定义一个或多个类型。类型是一个逻辑类型还是一个分区完全取决于你。通常情况下,一个类型被定义于具有一组共同字段的文档。如ttsla运维生成时间所有的数据存入在一个单一名为logstash-ttlsa的索引中,同时,定义了用户数据类型,帖子数据类型和评论类型。
类型相对于关系型数据库的表。
文档
文档是信息的基本单元,可以被索引的。文档是以JSON格式显示的
在类型中,可以根据需求存储多个文档
虽然一个文档在物理上位于一个索引,实际上一个文档必须在一个索引内被索引和分配一个类型。
文档相对于关系型数据库的列
分片和副本
在实际情况下,索引存储的数据可能超过单个节点的硬件限制。如一个10亿文档需要1T空间可能不适合存储在单个节点的硬盘上,或者单个节点搜索请求太慢。为了解决这个问题,elasticsearch提供将索引分成多个分片的功能。当在创建索引时,可以定义想要分片的数量。每一个分片就是一个全部功能的独立索引,可以位于集群中的任何节点上。
分片的两个最主要原因:
- 水平分割扩展,增加存储量
- 分布式并行跨分片操作,提高性能和吞量
分布式分片机制和搜索请求的文档如何汇总完全是有elasticsearch来控制的,这些对用户而言是透明的。
网络问题等等其他问题可以在任何时候不期而至,为了健壮性,强烈建议要有一个故障切换机制,无论何种故障以防止分片或节点不可用。
为此,elasticsearch让我们将索引分片复制一份为多份,称之为分片副本或副本。
副本也有两个主要原因:
高可用性,以应对分片或节点故障。出于这个原因,分片副本要在不同的节点上。
提供性能,增大吞吐量,搜索可以并行在所有副本上执行。
总之,每个索引可以被分成多个分片。索引也可以有0个或多个分片。索引也可以有0个或多个副本。复制后,每个索引都有主分片(母分片)和复制分片(复制于母分片)。分片和副本数量可以在每个索引被创建时定义。创建索引后,可以任何时候动态的修改副本数量,但是不能更改分片数。
默认情况下,elasticsearch为每个索引5个主分片和1个副本,这就意味着集群至少需要两个节点。索引将会有5个主分片和5个副本(1个完整副本),每个索引总共有10个分片。
每个elasticsearch分片是一个Lucene索引。一个单个Lucene索引有最大的文档数LUCENE-5843, 文档数限制为2147483519(MAX_VALUE – 128)。 可通过_cat/shards来监控分片大小。
2.2 logstash
2.2.1 logstash介绍
LogStash由Jruby语言编写,基于消息(message-based)的简单架构,并运行在java虚拟机(JVM)上。不同于分离的代理端(agent)和主机端(server),LogStash可配置单一的代理端(agent)与其他开源软件结合,以实现不同的功能。
2.2.2 logstash的四大组件
Shipper:发送事件(events)至LogStash;通常,远程代理端(agent)只需要运行这个组件即可;
Broker and Indexer:接收并索引化事件;
Search and Storage:允许对事件进行搜索和存储;
Web Interface:基于Web的展示界面
正是由于以上组件在LogStash架构中的独立部署,才提供了更好的集群扩展性。
2.2.3 LogStash主机分类
代理主机(agent host):作为事件的传递者(shipper),将各种数据日志发送至中心主机;只需运Logstash代理(agent)程序;
中心主机(central host):可运行包括中间转发器(Broker)、索引器(Indexer)、搜索和存储器(Search and Storage)、web界面端(web Interface)在内的各个组件,以实现对日志数据的接收、处理和存储。
2.3 Kibana
Logstash是一个完全开源的工具,他可以对你的日志进行收集、分析,并将其存储供以后使用(如搜索),你可以使用它。说到搜索,logstash带有一个web界面,搜索和展示所有日志。
第3章 使用ELK必要性(解决运维痛点)
开发人员不能登录线上服务器查看详细日志
各个系统都有日志,日志数据分散难以查找
日志数量大,查询速度慢,或者数据不够实时
第4章 elk部署之环境准备
4.1 机器准备
1台虚拟机:
hostname:elk
ip地址:10.0.0.11
4.2 系统环境
[root@elk ~]# cat /etc/redhat-release

CentOS Linux release 7.4.1708 (Core)

[root@elk ~]# uname -a

Linux elk 3.10.0-693.el7.x86_64 #1 SMP Tue Aug 22 21:09:27 UTC 2017 x86_64 x86_64 x86_64 GNU/Linux

[root@elk ~]# cat /etc/hosts

127.0.0.1   localhost localhost.localdomain localhost4 localhost4.localdomain4

::1         localhost localhost.localdomain localhost6 localhost6.localdomain6

10.0.0.11 elk
4.3 安装nginx,java,redis
yum install -y nginx java redis


[root@localhost ~]# java -version

openjdk version "1.8.0_171"

OpenJDK Runtime Environment (build 1.8.0_171-b10)

OpenJDK 64-Bit Server VM (build 25.171-b10, mixed mode)


[root@localhost ~]# which java

/usr/bin/java
提示:确保java为1.8以上版本,并且保证java在环境变量中能找到
4.4 安装elasticsearch 方法1
cd /root

wget https://artifacts.elastic.co/downloads/elasticsearch/elasticsearch-6.2.4.rpm

rpm -ivh elasticsearch-6.2.4.rpm
启动系统管理
systemctl daemon
重新载入系统初始
[root@elk ~]# systemctl daemon-reload

设置系统开机启动ES

[root@elk ~]# systemctl enable elasticsearch.service

Created symlink from /etc/systemd/system/multi-user.target.wants/elasticsearch.service to /usr/lib/systemd/system/elasticsearch.service.

启动ES服务

[root@elk ~]# systemctl start elasticsearch.service

检查ES服务状态

[root@elk ~]# systemctl status elasticsearch.service

● elasticsearch.service - Elasticsearch

   Loaded: loaded (/usr/lib/systemd/system/elasticsearch.service; enabled; vendor preset: disabled)

   Active: active (running) since Thu 2018-05-31 02:35:39 EDT; 7s ago

     Docs: http://www.elastic.co

 Main PID: 12766 (java)

   CGroup: /system.slice/elasticsearch.service

           └─12766 /bin/java -Xms1g -Xmx1g -XX:+UseConcMarkSweepGC -XX:CMSInitiatingOccupancyFraction=75 -XX:+UseCMSInitiatingOccu...


May 31 02:35:39 elk systemd[1]: Started Elasticsearch.

May 31 02:35:39 elk systemd[1]: Starting Elasticsearch...

May 31 02:35:40 elk elasticsearch[12766]: OpenJDK 64-Bit Server VM warning: If the number of processors is expected to incr...reads=N

Hint: Some lines were ellipsized, use -l to show in full.

使用curl命令检查9200端口是否返回json数据

[root@elk elasticsearch]# curl localhost:9200

{

  "name" : "KOp9XyC",

  "cluster_name" : "elasticsearch",

  "cluster_uuid" : "2LJAtbjwTZKaxJMVWzdXaA",

  "version" : {

    "number" : "6.2.4",

    "build_hash" : "ccec39f",

    "build_date" : "2018-04-12T20:37:28.497551Z",

    "build_snapshot" : false,

    "lucene_version" : "7.2.1",

    "minimum_wire_compatibility_version" : "5.6.0",

    "minimum_index_compatibility_version" : "5.0.0"

  },

  "tagline" : "You Know, for Search"

}
4.5 安装elasticsearch,方法2(推荐)
使用.tar.gz压缩包方式安装elasticearch
cd /opt

wget https://artifacts.elastic.co/downloads/elasticsearch/elasticsearch-6.2.4.tar.gz

tar -xzf elasticsearch-6.2.4.tar.gz

cd elasticsearch-6.2.4/


[root@elk ~]# tail -2 /etc/profile

export ES_HOME=/opt/elasticsearch-6.2.4


[root@elk ~]# source /etc/profile

[root@elk ~]# echo $ES_HOME

/opt/elasticsearch-6.2.4

#提示将ES安装目录设置为环境变量 $ES_HOME

#运行ES

cd /opt/elasticsearch

./bin/elasticsearch
默认地,ES在前台运行,打印输出日志可以使用Ctrl+C来停止
第5章 管理配置elasticsearch(参考修改环境配置)
5.1 管理linux-node1的elasticsearch
修改elasticsearch并授权
[root@linux-node1 ~]# grep -n '^[a-Z]' /etc/elasticsearch/elasticsearch.yml

17:cluster.name:chunck-cluster

#判别节点是否是统一集群

23:node.name: linux-node1

#节点的hostname

33:path.data: /data/es-data

#数据存放路径

37:path.logs: /var/log/elasticsearch/

#日志路径

43:bootstrap.memory_lock: true

#锁住内存,使内存不会再swap中使用

54:network.host: 0.0.0.0

#允许访问的ip

58:http.port: 9200

#端口
可复制代码
[root@linux-node1 ~]# grep '^[a-Z]' /etc/elasticsearch/elasticsearch.yml

cluster.name:chunck-cluster

node.name: linux-node1

path.data: /data/es-data

path.logs: /var/log/elasticsearch/

bootstrap.memory_lock: true

network.host: 0.0.0.0

http.port: 9200
[root@linux-node1 ~]# mkdir -p /data/es-data

[root@linux-node1 ~]# chown  elasticsearch.elasticsearch /data/es-data/
启动elasticsearch
systemctl enable-reload

systemctl start elasticsearch

systemctl enable elasticsearch

systemctl status elasticsearch
查看elasticsearch环境
[root@elk1 ~]# curl -i -XGET 'http://10.0.0.11:9200'

HTTP/1.1 200 OK

content-type: application/json; charset=UTF-8

content-length: 433


{

  "name" : "elk1",

  "cluster_name" : "my-application",

  "cluster_uuid" : "1XjdbJM8THeVxluBk8GkIw",

  "version" : {

    "number" : "6.2.4",

    "build_hash" : "ccec39f",

    "build_date" : "2018-04-12T20:37:28.497551Z",

    "build_snapshot" : false,

    "lucene_version" : "7.2.1",

    "minimum_wire_compatibility_version" : "5.6.0",

    "minimum_index_compatibility_version" : "5.0.0"

  },

  "tagline" : "You Know, for Search"

}
5.2 与elasticsearch通信
5.2.1 JavaAPI
node client
Transport client
5.2.2 RESTful API (推荐)
json 格式 数据
可以通过curl 命令或浏览器请求显示结果
curl -i -XGET 'http://10.0.0.11:9200/_count?pertty' -d ' {"query":{"match_all":{}}}'
-i, --include (包含响应头)
(HTTP) Include the HTTP-header in the output. The
HTTP-header includes things like server-name,
date of the document, HTTP-version and more...
5.2.3 其他语言的API
js,.NET,PHP,Perl,Python,Ruby
5.3 安装head插件
博客地址
https://www.cnblogs.com/Onlywjy/p/Elasticsearch.html
追加到ES配置文件,与head插件关联
[root@elk elasticsearch]# tail -2 /etc/elasticsearch/elasticsearch.yml

http.cors.enabled: true

http.cors.allow-origin: "*"
重启ES服务
[root@elk elasticsearch]# systemctl restart elasticsearch.service
查看端口
[root@elk elasticsearch]# ss -ltnup | grep "9200|9300" -E

tcp    LISTEN     0      128    ::ffff:10.0.0.11:9200                 :::*                   users:(("java",pid=13226,fd=119))

tcp    LISTEN     0      128    ::ffff:10.0.0.11:9300                 :::*                   users:(("java",pid=13226,fd=111))
5.3.1 前提条件,配置并启动ES,确保ES服务正常
cd /opt

#下载head插件

wget  https://github.com/mobz/elasticsearch-head/archive/master.zip

yum install -y unzip

unzip master.zip
5.3.2 安装node
wget https://npm.taobao.org/mirrors/node/latest-v4.x/node-v4.4.7-linux-x64.tar.gz

tar -zxvf node-v4.4.7-linux-x64.tar.gz
5.3.3 设置环境变量
vim /etc/profile

#set node envirnoment

export NODE_HOME=/opt/node-v4.4.7-linux-64

export PATH=$PATH:$NODE_HOME/bin

export NODE_PATH=$NODE_HOME/lib/node_node_modules
执行
source /etc/profile
5.3.4 安装grunt
grunt 是基于Node.js的项目构建工具,可以进行打包压缩,测试,执行等的工作,head插件就是通过grunt启动
yum install -y npm

cd /op/elasticsearch-head-master

npm install -g grunt-cli grunt
提示如果上一步报错了,不用担心,继续下一步
检查是否安装成功
[root@elk1 ~]# grunt -version

grunt-cli v1.2.0
5.3.5 修改head插件配置文件
修改服务器监听地址:Gruntfile.js
在文件的第93行,修改端口为9100
如下所示
connect: {

 91                         server: {

 92                                 options: {

 93                                         port: 9100,

 94                                         base: '.',

 95                                         keepalive: true

 96                                 }

 97                         }

 98                 }
修改当前 _site/app.js
在第4354行,将主机地址修改为当前主机地址
4351                 init: function(parent) {

4352                         this._super();

4353                         this.prefs = services.Preferences.instance();

4354                         this.base_uri = this.config.base_uri || this.prefs.get("app-base_uri") || "http://10.0.0.11:9200";

4355                         if( this.base_uri.charAt( this.base_uri.length - 1 ) !== "/" ) {

4356                                 // XHR request fails if the URL is not ending with a "/"

4357                                 this.base_uri += "/";

4358                         }
5.3.6 启动head插件
在/opt/elasticsearch-head-master 目录下
执行以下命令 初始化安装时,仅执行一次,服务开启一次,就不需要执行了
npm install
提示此处出现错误,不需要理会,继续下一步
此处是启动真正的es-head 插件服务,放入后台执行
grunt server >> es-9100.log &
浏览器访问如下图所示

修改配置文件易报错提示信息
https://blog.csdn.net/kellerxq/article/details/51392507
elasticsearch的服务器响应异常及应对策略(错误解决方案)
https://www.cnblogs.com/jiu0821/p/6075833.html
can not run elasticsearch as root
5.4 es集群设置
两台服务都要保护一致
5.4.1 内存锁配置
修改内存锁配置文件
vim /etc/security/limits.conf

#追加信息

# allow user 'elasticsearch' mlockall

elasticsearch soft memlock unlimited

elasticsearch hard memlock unlimited
重启elasticsearch 服务
5.4.2 打开文件配置
[root@elk2 ~]# ulimit -a | grep 'open files'

open files                      (-n) 1024
提示:生产环境要打开的文件很多,需要调整打开文件的数据,尽量改为65536
5.4.3 修改elasticsearch.yaml配置文件
将组播地址修改为单播地址
centos7.x中组播有问题,等待查询问题
5.5 安装bigdesk插件(用于监控es)
参考博客地址
5.6 kopf
参考博客地址
5.7 节点发现
5.7.1 组播
未验证
5.7.2 单播
推荐使用单播,生产使用单播
5.8 分片过程
第6章 LogStach
6.1 安装LogStach
安装说明:
参考上面的连接:
操作提示:
- 下载解压logstash
- logstash.conf编写配置文件
- 运行 bin/logstash -f logstash.conf
- 学习入门指南和视频。
安装
wget https://artifacts.elastic.co/downloads/logstash/logstash-6.2.4.rpm

rpm -ivh logstash-6.2.4.rpm
启动 查看状态 及停止
systemctl start logstash.service

systemctl status logstash.service

systemctl stop logstash.service
logstash安装目录为: /usr/share/logstash
启动一个logstash,-e:在命令行执行;input输入,stdin标准输入,是一个插件;output输出,stdout:标准输出
cd /usr/share/logstash

[root@elk1 ~]# /usr/share/logstash/bin/logstash -e 'input { stdin{} } output { stdout{  } }'

OpenJDK 64-Bit Server VM warning: If the number of processors is expected to increase from one, then you should configure the number of parallel GC threads appropriately using -XX:ParallelGCThreads=N

hello,bjgs (#输入内容,要等一会)

WARNING: Could not find logstash.yml which is typically located in $LS_HOME/config or /etc/logstash. You can specify the path using --path.settings. Continuing using the defaults

Could not find log4j2 configuration at path /usr/share/logstash/config/log4j2.properties. Using default config which logs errors to the console

[INFO ] 2018-05-25 03:11:17.711 [main] scaffold - Initializing module {:module_name=>"fb_apache", :directory=>"/usr/share/logstash/modules/fb_apache/configuration"}

[INFO ] 2018-05-25 03:11:17.765 [main] scaffold - Initializing module {:module_name=>"netflow", :directory=>"/usr/share/logstash/modules/netflow/configuration"}

[WARN ] 2018-05-25 03:11:18.844 [LogStash::Runner] multilocal - Ignoring the 'pipelines.yml' file because modules or command line options are specified

[INFO ] 2018-05-25 03:11:19.351 [LogStash::Runner] runner - Starting Logstash {"logstash.version"=>"6.2.4"}

[INFO ] 2018-05-25 03:11:19.747 [Api Webserver] agent - Successfully started Logstash API endpoint {:port=>9600}

[INFO ] 2018-05-25 03:11:20.953 [Ruby-0-Thread-1: /usr/share/logstash/vendor/bundle/jruby/2.3.0/gems/stud-0.0.23/lib/stud/task.rb:22] pipeline - Starting pipeline {:pipeline_id=>"main", "pipeline.workers"=>1, "pipeline.batch.size"=>125, "pipeline.batch.delay"=>50}

The stdin plugin is now waiting for input:

[INFO ] 2018-05-25 03:11:21.063 [Ruby-0-Thread-1: /usr/share/logstash/vendor/bundle/jruby/2.3.0/gems/stud-0.0.23/lib/stud/task.rb:22] pipeline - Pipeline started successfully {:pipeline_id=>"main", :thread=>"#<Thread:0xb461d16@/usr/share/logstash/logstash-core/lib/logstash/pipeline.rb:247 run>"}

[INFO ] 2018-05-25 03:11:21.129 [Ruby-0-Thread-1: /usr/share/logstash/vendor/bundle/jruby/2.3.0/gems/stud-0.0.23/lib/stud/task.rb:22] agent - Pipelines running {:count=>1, :pipelines=>["main"]}

#显示结果

{

       "message" => "hello,bjgs",

      "@version" => "1",

    "@timestamp" => 2018-05-25T07:11:21.106Z,

          "host" => "elk"

}
参考网址
https://www.cnblogs.com/nulige/p/6680336.html
6.2 将logstash的内容写入到es中
[root@elk1 ~]# /usr/share/logstash/bin/logstash -e 'input { stdin{} } output { elasticsearch{ hosts=>["10.0.0.11:9200"] } }'

OpenJDK 64-Bit Server VM warning: If the number of processors is expected to increase from one, then you should configure the number of parallel GC threads appropriately using -XX:ParallelGCThreads=N

hello,bjgs

WARNING: Could not find logstash.yml which is typically located in $LS_HOME/config or /etc/logstash. You can specify the path using --path.settings. Continuing using the defaults

Could not find log4j2 configuration at path /usr/share/logstash/config/log4j2.properties. Using default config which logs errors to the console

[INFO ] 2018-05-25 03:23:18.261 [main] scaffold - Initializing module {:module_name=>"fb_apache", :directory=>"/usr/share/logstash/modules/fb_apache/configuration"}

[INFO ] 2018-05-25 03:23:18.281 [main] scaffold - Initializing module {:module_name=>"netflow", :directory=>"/usr/share/logstash/modules/netflow/configuration"}

[WARN ] 2018-05-25 03:23:19.245 [LogStash::Runner] multilocal - Ignoring the 'pipelines.yml' file because modules or command line options are specified

[INFO ] 2018-05-25 03:23:19.653 [LogStash::Runner] runner - Starting Logstash {"logstash.version"=>"6.2.4"}

[INFO ] 2018-05-25 03:23:19.973 [Api Webserver] agent - Successfully started Logstash API endpoint {:port=>9600}

[INFO ] 2018-05-25 03:23:21.340 [Ruby-0-Thread-1: /usr/share/logstash/vendor/bundle/jruby/2.3.0/gems/stud-0.0.23/lib/stud/task.rb:22] pipeline - Starting pipeline {:pipeline_id=>"main", "pipeline.workers"=>1, "pipeline.batch.size"=>125, "pipeline.batch.delay"=>50}

[INFO ] 2018-05-25 03:23:22.337 [[main]-pipeline-manager] elasticsearch - Elasticsearch pool URLs updated {:changes=>{:removed=>[], :added=>[http://10.0.0.11:9200/]}}

[INFO ] 2018-05-25 03:23:22.340 [[main]-pipeline-manager] elasticsearch - Running health check to see if an Elasticsearch connection is working {:healthcheck_url=>http://10.0.0.11:9200/, :path=>"/"}

[WARN ] 2018-05-25 03:23:22.694 [[main]-pipeline-manager] elasticsearch - Restored connection to ES instance {:url=>"http://10.0.0.11:9200/"}

[INFO ] 2018-05-25 03:23:23.338 [[main]-pipeline-manager] elasticsearch - ES Output version determined {:es_version=>6}

[WARN ] 2018-05-25 03:23:23.339 [[main]-pipeline-manager] elasticsearch - Detected a 6.x and above cluster: the `type` event field won't be used to determine the document _type {:es_version=>6}

[INFO ] 2018-05-25 03:23:23.381 [[main]-pipeline-manager] elasticsearch - Using mapping template from {:path=>nil}

[INFO ] 2018-05-25 03:23:23.397 [[main]-pipeline-manager] elasticsearch - Attempting to install template {:manage_template=>{"template"=>"logstash-*", "version"=>60001, "settings"=>{"index.refresh_interval"=>"5s"}, "mappings"=>{"_default_"=>{"dynamic_templates"=>[{"message_field"=>{"path_match"=>"message", "match_mapping_type"=>"string", "mapping"=>{"type"=>"text", "norms"=>false}}}, {"string_fields"=>{"match"=>"*", "match_mapping_type"=>"string", "mapping"=>{"type"=>"text", "norms"=>false, "fields"=>{"keyword"=>{"type"=>"keyword", "ignore_above"=>256}}}}}], "properties"=>{"@timestamp"=>{"type"=>"date"}, "@version"=>{"type"=>"keyword"}, "geoip"=>{"dynamic"=>true, "properties"=>{"ip"=>{"type"=>"ip"}, "location"=>{"type"=>"geo_point"}, "latitude"=>{"type"=>"half_float"}, "longitude"=>{"type"=>"half_float"}}}}}}}}

[INFO ] 2018-05-25 03:23:23.435 [[main]-pipeline-manager] elasticsearch - Installing elasticsearch template to _template/logstash

[INFO ] 2018-05-25 03:23:23.632 [[main]-pipeline-manager] elasticsearch - New Elasticsearch output {:class=>"LogStash::Outputs::ElasticSearch", :hosts=>["//10.0.0.11:9200"]}

The stdin plugin is now waiting for input:

[INFO ] 2018-05-25 03:23:23.713 [Ruby-0-Thread-1: /usr/share/logstash/vendor/bundle/jruby/2.3.0/gems/stud-0.0.23/lib/stud/task.rb:22] pipeline - Pipeline started successfully {:pipeline_id=>"main", :thread=>"#<Thread:0x4f6c9282@/usr/share/logstash/logstash-core/lib/logstash/pipeline.rb:247 run>"}

[INFO ] 2018-05-25 03:23:23.789 [Ruby-0-Thread-1: /usr/share/logstash/vendor/bundle/jruby/2.3.0/gems/stud-0.0.23/lib/stud/task.rb:22] agent - Pipelines running {:count=>1, :pipelines=>["main"]}
在es-head中查找索引信息

6.2.1 同时写入日志和es中
/usr/share/logstash/bin/logstash -e 'input { stdin{} } output { elasticsearch{ hosts=>["10.0.0.11:9200"]} stdout{ codec => rubydebug} }'
6.3 修改配置文件
参考官方文档
https://www.elastic.co/guide/en/logstash/current/configuration.html
vim /etc/logstash/conf.d/logstash-simple.conf

input { stdin { } }

output {

  elasticsearch { hosts => ["localhost:9200"] }

  stdout { codec => rubydebug }

}

#启动logstash

/usr/share/logstash/bin/logstash -f /etc/logstash/conf.d/logstash-simple.conf

#查看logstash

ps -ef | grep logstash
6.3.1 配置文件详细内容
6.3.2 input plugin
https://www.elastic.co/guide/en/logstash/current/input-plugins.html
discover_interval 间隔多少秒自动发现
sincedb_path 指定记录文件的标记 flag-游标
sincedb_write_interval 多久记录一次游标,默认15秒记一次
start_postion 收集方式,默认从尾部收集 一般设置为["begining","end"]
index 指定索引
提示:logstash收集的第一行称为一个事件
配置文件
6.3.3 output plugin
6.3.4 fiilter plugin
6.3.5 codec plugin
6.4 将多行集合成一个事件,收集java日志
将多行收集到一个事件中,codec的使用,他里面有一个多行的插件
6.4.1 测试时,写demo时
一般的操作思路,输出时,不要先输出到es,不好排查是收集的问题还是输出的问题,
标准输入,使用codec,再标准输出,
错误示例为:写file.conf 测试,写入到es,查看结果,再写file.conf,写入到es,再测。。。。
mutiline.conf 示例demo
使用codec插件,使用多行模式匹配正则pattern
input{

         stdin{

                   codec => multiline{

                            pattern => "["

                            negate => true

                            what => "previous"

                   }

         }

}

output {

         stdout {

                   codec => "rubydebug"

         }

}
测试启动logstash 指定mutiline.conf配置文件,这里将结果输出到屏幕上
/usr/share/logstash/bin/logstash -f file.conf


[root@elk1 ~]# /usr/share/logstash/bin/logstash -f mutiline.conf OpenJDK 64-Bit Server VM warning: If the number of processors is expected to increase from one, then you should configure the number of parallel GC threads appropriately using -XX:ParallelGCThreads=N

[1]

[2]

[3]

fds

hewiqfq

[sasa]

查看输出结果

{

    "@timestamp" => 2018-05-28T01:40:53.017Z,

      "@version" => "1",

       "message" => "[1]",

          "host" => "elk1"

}

[3]

{

    "@timestamp" => 2018-05-28T01:41:04.957Z,

      "@version" => "1",

       "message" => "[2]",

          "host" => "elk1"

}

fds

hewiqfq

[sasa]

{

    "@timestamp" => 2018-05-28T01:41:19.495Z,

      "@version" => "1",

       "message" => "[3]
fds
hewiqfq",

          "tags" => [

        [0] "multiline"

    ],

          "host" => "elk1"

}
提示:只有在 [ 符号出现后,才能把之前的数据打印到终端
提示:对php,java等程序日志,使用正则表达式,分隔日志,以达到程序员可根据上下文快速定位并解决问题的条件
6.5 收集nginx日志
以下为标准nginx日志格式
    log_format  main  '$remote_addr - $remote_user [$time_local] "$request" '

                       '$status $body_bytes_sent "$http_referer" '

                      '"$http_user_agent" "$http_x_forwarded_for"';
修改为json格式日志,因为codec有一个json的插件,及以后使用正则表达式匹配(不推荐),原因占cpu,写起来难,修改起来难,匹配起来难。
日志标准化方向:json。线上日志,访问日志,使用json,错误日志使用正常模式。
官方文档地址
http://nginx.org/en/docs/http/ngx_http_log_module.html#log_format
将以下代码添加到nginx.conf配置文件中
参数网址
https://yq.aliyun.com/ziliao/29200
log_format logstash_json '{ "@timestamp": "$time_local", '

                         '"@fields": { '

                         '"remote_addr": "$remote_addr", '

                         '"remote_user": "$remote_user", '

                         '"body_bytes_sent": "$body_bytes_sent", '

                         '"request_time": "$request_time", '

                         '"status": "$status", '

                         '"request": "$request", '

                         '"request_method": "$request_method", '

                         '"http_referrer": "$http_referer", '

                         '"body_bytes_sent":"$body_bytes_sent", '

                         '"http_x_forwarded_for": "$http_x_forwarded_for", '

                         '"http_user_agent": "$http_user_agent" } }';

access_log  /var/log/nginx/access_json.log  logstash_json;
保存nginx.conf后
查看配置文件语法
nginx -t
重启nginx 服务
systemctl restart nginx.service
查看端口
ss -ltnup | grep 80
通过浏览器访问,或curl ,wget 等
查看json格式访问日志
tail -f /var/log/nginx/access_json.log
logstash的配置文件 nginx.conf
input{

         file{

                   path => "/var/log/nginx/access_json.log"

                   codec => "json"

                   start_position => "beginning"


         }

}

output{

         stdout{

                   codec => "rubydebug"

         }

}
使用以下命令启动
/usr/share/logstash/bin/logstash -f nginx.conf
提示,没有写入到file.conf中,实际上可以通过写入file.conf,来追加到es中方便存储
6.6 system.log
system.log日志文件
input{

         syslog{

                   type => "system-syslog"

                   host => "10.0.0.11"

                   port => "514"

         }

}


output{

         stdout{

                   codec => "rubydebug"

         }

}
监听514端口
启动命令
/usr/share/logstash/bin/logstash -f system.conf
查看514端口,即logstash可以监控tcp,udp的514端口
netstat -ltnup | grep -e "514"

tcp6       0      0 10.0.0.11:514           :::*                    LISTEN      6581/java

udp        0      0 10.0.0.11:514           0.0.0.0:*                           6581/java
原日志
vim /etc/rsyslog.conf

#*.* @@remote-host:514

修改后

grep  "^*" /etc/rsyslog.conf | grep 514

*.* @@10.0.0.11:514
重启日志程序
systemctl restart rsyslog.service
如果此时登录或退出系统,在另一个终端会显示所有系统日志信息
如下所示
{

          "severity" => 6,

               "pid" => "7304",

          "priority" => 86,

          "facility" => 10,

           "program" => "sshd",

              "type" => "system-syslog",

         "logsource" => "elk1",

           "message" => "pam_unix(sshd:session): session opened for user root by (uid=0)
",

        "@timestamp" => 2018-05-28T07:46:57.000Z,

    "severity_label" => "Informational",

          "@version" => "1",

         "timestamp" => "May 28 03:46:57",

              "host" => "10.0.0.11",

    "facility_label" => "security/authorization"

}
写入到file.conf
input{

        syslog {

                type => "system-syslog"

                host => "10.0.0.11"

                port => "514"

        }

}

output{

       if [type] == "system-syslog" {

                elasticsearch{

                        hosts => ["10.0.0.11:9200"]

                        index => "system-syslog-%{+YYYY.MM.dd}"

                }

        }

}
执行以下命令
/usr/share/logstash/bin/logstash -f file.conf
打开一个新的终端,反复执行以下命令
logger "测试随机数$RANDOM"
在浏览器中打开 http://10.0.0.11:5601 通过建立搜索索引
可以查看出以下json串内容
在head插件中查询显示的结果
{

  "_index": "system-syslog-2018.05.28",

  "_type": "doc",

  "_id": "XjbDpWMBbiQ_aTCCRyqM",

  "_score": 1,

  "_source": {

    "facility_label": "user-level",

    "type": "system-syslog",

    "logsource": "elk1",

    "@timestamp": "2018-05-28T08:00:28.000Z",

    "@version": "1",

    "message": "测试随机数19717
",

    "priority": 13,

    "timestamp": "May 28 04:00:28",

    "facility": 1,

    "severity_label": "Notice",

    "host": "10.0.0.11",

    "program": "root",

    "severity": 5

  },

  "fields": {

    "@timestamp": [

      "2018-05-28T08:00:28.000Z"

    ]

  }

}
6.7 tcp插件收集
一般地,对于tcp插件的使用场景为,在es索引丢失时,通过手工查找,定向到文件,再通过nc 等命令写入到logstash中
vim tcp.conf

input{

         tcp {

                   host => "10.0.0.11"

                   port => "6666"

         }

}


output {

         stdout {

                   codec => "rubydebug"

         }

}
新开一个终端,将文件内容在logstash终端显示
将/etc/hosts文件发送到logstash中
nc 10.0.0.11 6666 < /etc/hosts
将字符串发送到logstash终端
echo "无梦至胜" | nc 10.0.0.11 6666
提示:如果文件较大,传输时间很长,建议开启screen命令
6.8 收集winlog错误
[FATAL] 2018-05-28 23:32:39.555 [LogStash::Runner] runner - Logstash could not be started because there is already another instance using the configured data directory.  If you wish to run multiple instances, you must change the "path.data" setting.

[ERROR] 2018-05-28 23:32:39.580 [LogStash::Runner] Logstash - java.lang.IllegalStateException: org.jruby.exceptions.RaiseException: (SystemExit) exit
6.9 filter 过滤
官网地址
https://www.elastic.co/guide/en/logstash/current/filter-plugins.html
grok 插件
https://www.elastic.co/guide/en/logstash/current/plugins-filters-grok.html
编辑配置文件
vim grok.conf

input{

         stdin{

         }

}


filter {

         grok {

                   match => {

                            "message" => "%{IP:client} %{WORD:method} %{URIPATHPARAM:request} %{NUMBER:bytes} %{NUMBER:duration}"

                   }

         }

}


output {

         stdout {

                   codec => "rubydebug"

         }

}

logstash -f grok.conf
程序启动后,在当前终端输入
55.3.244.1 GET /index.html 15824 0.043
显示结果为
{

    "@timestamp" => 2018-05-30T01:20:04.201Z,

          "host" => "elk1",

        "method" => "GET",

       "request" => "/index.html",

       "message" => "55.3.244.1 GET /index.html 15824 0.043",

         "bytes" => "15824",

        "client" => "55.3.244.1",

      "duration" => "0.043",

      "@version" => "1"

}
提示:过滤的这个规则
"message" => "%{IP:client} %{WORD:method} %{URIPATHPARAM:request} %{NUMBER:bytes} %{NUMBER:duration}"
在grok官网上有规则库,可以直接引用
https://github.com/logstash-plugins/logstash-patterns-core/blob/master/patterns/grok-patterns
在安装logstash的目录下也有上面的正则库
/usr/share/logstash/vendor/bundle/jruby/2.3.0/gems/logstash-patterns-core-4.1.2/patterns/
我们对于常规的内容,我们只需要引用其他中的正则即可
6.10 使用正则收集mysql-slow.log
此处需要大量引用正则表达式
第7章 kibana
7.1 官方地址
7.2 下载安装
网址
https://www.elastic.co/guide/en/kibana/current/targz.html
wget https://artifacts.elastic.co/downloads/kibana/kibana-6.2.4-linux-x86_64.tar.gz

mv kibana-6.2.4-linux-x86_64.tar.gz /usr/share/

cd /usr/share

tar -xzf kibana-6.2.4-linux-x86_64.tar.gz

ln -s kibana-6.2.4-linux-x86_64 kibana

cd kibana-6.2.4-linux-x86_64/
设置环境变量
vim /etc/profile

#set kibana path

export KIBANA=/usr/share/kibana/


[root@elk kibana]# source /etc/profile

 [root@elk kibana]# echo $KIBANA

/usr/share/kibana/

ln -s /usr/share/kibana/bin/kibana /bin/kibana
7.3 编辑配置文件
vim /usr/share/kibana/config/kibana.yml

grep "^[^#]" /usr/share/kibana/config/kibana.yml

server.port: 5601

server.host: "elk1"

elasticsearch.url: "http://10.0.0.11:9200"

kibana.index: ".kibana"
提示:以上修改的地方分别是kibana的端口,主机,url,和kibana的索引
7.4 启动kibana
提示:一般地使用screen使kibana在后台运行
yum install -y screen
提示:screen使用技巧
screen 回车,相当于进入了指定的终端
/usr/share/kibana/bin/kibana 启动kibana
CRTL + A +D 退出当前screen 但是不退出screen中运行的进程
此时通过浏览器访问 ,显示如下图所示内容
7.5 创建默认索引
提示:一般地,在第二步中不使用时间过滤
7.6 使用kibana
8.收集win系统日志
控制面板->管理工作->事件查看器->windows日志
8.1 需求说明
收集和存储win服务器关键系统日志和程序日志,应对安全审计要求
基于win账户登录日志进行安全事件分析
8.2 winlogbeat工具介绍
Elasticsearch官方提供的轻量级win事件日志转发代理
日志数据流:winlogbeat à Logstash à Elasticsearch
采取这样的部署方式是基于如下考虑:
1.windows 服务器默认部署后就不需要做任何变更了
2.如果对默认win日志映射不满意,可以在logstash上重新调整
8.2.1 部署安装
官方文档
https://www.elastic.co/downloads/beats/winlogbeat
提示安装步骤
1.下载并解压
2.编辑winlogbeat.yml配置文件
3.运行powershell winlogbeat.exe -c winlogbeat.yml
4.查看运行情况
8.2.2 编辑配置文件
设置日志收集参数、转发服务器参数等
配置文件官方参考网址
https://www.elastic.co/guide/en/beats/winlogbeat/index.html
收集三类日志:Application/Security/System,72小时前的日志忽略
winlogbeat.event_logs:

  - name: Application

    ignore_older: 72h

  - name: Security

  - name: System
将Elasticsearch output 下面的选项注释
#-------------------------- Elasticsearch output ------------------------------

# output.elasticsearch:

  # Array of hosts to connect to.

  # hosts: ["localhost:9200"]

修改Logstash output下的hosts选项

#----------------------------- Logstash output --------------------------------

output.logstash:

  # The Logstash hosts

  hosts: ["10.0.0.11:5044"]
以下为修改的配置
其中 10.0.0.11 是Logstash服务的ip地址,实际部署时请参考正确的ip地址
请确保防火墙策略库允许win服务器访问到Logstash服务器的TCP 5044端口
8.3 安装
启动powershell
进入到安装目录,并执行 .install-service-winlogbeat.ps1 文件
PS C:UserslenovoDesktopwinlogbeat-6.2.4-windows-x86_64> .install-service-winlogbeat.ps1
8.4 解决错误禁止运行此脚本
错误提示如下:
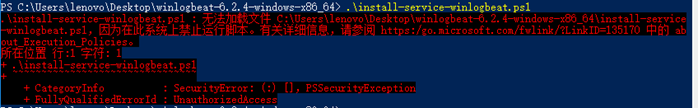
参考官方文档
https://technet.microsoft.com/zh-CN/library/hh847748.aspx
错误提示:以管理员方式运行

提示错误:

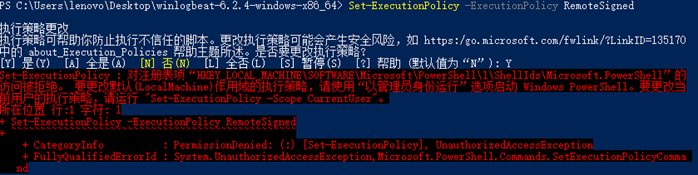
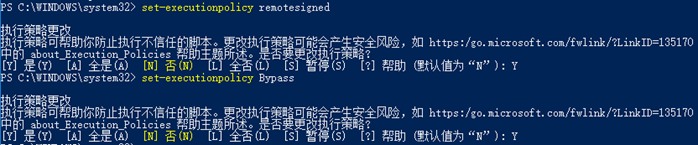
在powershell中执行以下命令,输入确认命令按Y
set-executionpolicy remotesigned

set-executionpolicy Bypass
检查配置文件正确性
.winlogbeat.exe test config -c .winlogbeat.yml -e

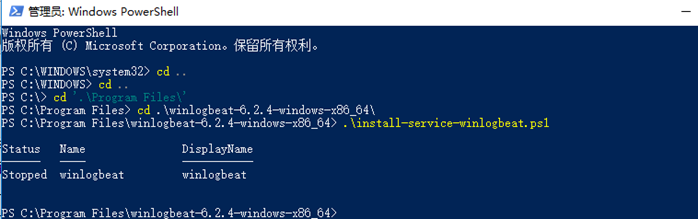
8.5 启动服务
启动日志收集代理服务,也可以在服务里启动winlogbeat
net start winlogbeat
查看当前winlogbeat状态
tasklist | findstr winlogbeat
8.6 验证
本地确认winlogbeat服务工作正常
程序自身日志正常
运程logstash工作正常
kibana能搜索到win日志
8.7 性能
在没有日志产生的情况下,winlogbeat进程工作内存9M,有日志生产情况下,小于100M内存
8.8 维护
启动服务

net start winlogbeat

停止服务

net stop winlogbeat

卸载服务

powershell "C:Program Fileswinlogbeat-6.2.4-windows-x86_64uninstall-service-winlogbeat.ps1"
8.9 配置Elsaticsearch服务端接收win系统日志
Beats数据采集-winlogbeat使用指南
Beats是elsatic公司的一款轻量级数据采集产品,它包含了几个子产品:
packebeat(用于监控网络流量)
filebeat(用于监控日志数据,可以替代logstash-input-file)
topbeat(用于搜集进程的信息、负载、内存、磁盘等数据)
winlogbeat(用于搜集windows事件日志)
另外社区还提供了dockerbeat工具。由于他们都是基于libbeat写出来的,因此配置上基本相同,只是input输入的地方各有差异。
8.9.1 内容介绍
- 关于powershell的使用
- packetbat的下载,部署,使用,结果样例
- filebeat的下载,部署,使用,样例
- topbeat的样例
- winlogbeat的样例
8.9.2 关于powershell
elastic中Beats在win环境中基本使用的是PS脚本,因此用户必须对PS有一定的了解。PS可以理解为win对命令行的高级封装,加了个壳,支持高级用法。win7开始内置PS命令。XP等系统需要手动安装
对于服务的安装,我们需要管理员权限
8.9.2.1 启动PS
图形化启动略过
命令行启动
输入powershell即可
8.9.2.2 开启脚本限制
默认情况下,系统会禁止运行脚本,返回以下错误
PS E:packetbeat> .install-service-packetbeat.ps1

无法加载文件 E:packetbeatinstall-service-packetbeat.ps1,因为在此系统中禁止执

行脚本。有关详细信息,请参阅 "get-help about_signing"。

所在位置 行:1 字符: 33

+ .install-service-packetbeat.ps1 <<<<

    + CategoryInfo          : NotSpecified: (:) [], PSSecurityException

+ FullyQualifiedErrorId : RuntimeException
需要修改参数执行下面的命令,开启PS脚本功能
set-ExecutionPolicy RemoteSigned
第9章 解决elk常见的问题
9.1 编码问题


  codec {

    plain {

      # This setting must be a ["ASCII-8BIT", "UTF-8", "US-ASCII", "Big5", "Big5-HKSCS", "Big5-UAO", "CP949", "Emacs-Mule", "EUC-JP", "EUC-KR", "EUC-TW", "GB2312", "GB18030", "GBK", "ISO-8859-1", "ISO-8859-2", "ISO-8859-3", "ISO-8859-4", "ISO-8859-5", "ISO-8859-6", "ISO-8859-7", "ISO-8859-8", "ISO-8859-9", "ISO-8859-10", "ISO-8859-11", "ISO-8859-13", "ISO-8859-14", "ISO-8859-15", "ISO-8859-16", "KOI8-R", "KOI8-U", "Shift_JIS", "UTF-16BE", "UTF-16LE", "UTF-32BE", "UTF-32LE", "Windows-31J", "Windows-1250", "Windows-1251", "Windows-1252", "IBM437", "IBM737", "IBM775", "CP850", "IBM852", "CP852", "IBM855", "CP855", "IBM857", "IBM860", "IBM861", "IBM862", "IBM863", "IBM864", "IBM865", "IBM866", "IBM869", "Windows-1258", "GB1988", "macCentEuro", "macCroatian", "macCyrillic", "macGreek", "macIceland", "macRoman", "macRomania", "macThai", "macTurkish", "macUkraine", "CP950", "CP951", "IBM037", "stateless-ISO-2022-JP", "eucJP-ms", "CP51932", "EUC-JIS-2004", "GB12345", "ISO-2022-JP", "ISO-2022-JP-2", "CP50220", "CP50221", "Windows-1256", "Windows-1253", "Windows-1255", "Windows-1254", "TIS-620", "Windows-874", "Windows-1257", "MacJapanese", "UTF-7", "UTF8-MAC", "UTF-16", "UTF-32", "UTF8-DoCoMo", "SJIS-DoCoMo", "UTF8-KDDI", "SJIS-KDDI", "ISO-2022-JP-KDDI", "stateless-ISO-2022-JP-KDDI", "UTF8-SoftBank", "SJIS-SoftBank", "BINARY", "CP437", "CP737", "CP775", "IBM850", "CP857", "CP860", "CP861", "CP862", "CP863", "CP864", "CP865", "CP866", "CP869", "CP1258", "Big5-HKSCS:2008", "ebcdic-cp-us", "eucJP", "euc-jp-ms", "EUC-JISX0213", "eucKR", "eucTW", "EUC-CN", "eucCN", "CP936", "ISO2022-JP", "ISO2022-JP2", "ISO8859-1", "ISO8859-2", "ISO8859-3", "ISO8859-4", "ISO8859-5", "ISO8859-6", "CP1256", "ISO8859-7", "CP1253", "ISO8859-8", "CP1255", "ISO8859-9", "CP1254", "ISO8859-10", "ISO8859-11", "CP874", "ISO8859-13", "CP1257", "ISO8859-14", "ISO8859-15", "ISO8859-16", "CP878", "MacJapan", "ASCII", "ANSI_X3.4-1968", "646", "CP65000", "CP65001", "UTF-8-MAC", "UTF-8-HFS", "UCS-2BE", "UCS-4BE", "UCS-4LE", "CP932", "csWindows31J", "SJIS", "PCK", "CP1250", "CP1251", "CP1252", "external", "locale"]

      # Expected one of ["ASCII-8BIT", "UTF-8", "US-ASCII", "Big5", "Big5-HKSCS", "Big5-UAO", "CP949", "Emacs-Mule", "EUC-JP", "EUC-KR", "EUC-TW", "GB2312", "GB18030", "GBK", "ISO-8859-1", "ISO-8859-2", "ISO-8859-3", "ISO-8859-4", "ISO-8859-5", "ISO-8859-6", "ISO-8859-7", "ISO-8859-8", "ISO-8859-9", "ISO-8859-10", "ISO-8859-11", "ISO-8859-13", "ISO-8859-14", "ISO-8859-15", "ISO-8859-16", "KOI8-R", "KOI8-U", "Shift_JIS", "UTF-16BE", "UTF-16LE", "UTF-32BE", "UTF-32LE", "Windows-31J", "Windows-1250", "Windows-1251", "Windows-1252", "IBM437", "IBM737", "IBM775", "CP850", "IBM852", "CP852", "IBM855", "CP855", "IBM857", "IBM860", "IBM861", "IBM862", "IBM863", "IBM864", "IBM865", "IBM866", "IBM869", "Windows-1258", "GB1988", "macCentEuro", "macCroatian", "macCyrillic", "macGreek", "macIceland", "macRoman", "macRomania", "macThai", "macTurkish", "macUkraine", "CP950", "CP951", "IBM037", "stateless-ISO-2022-JP", "eucJP-ms", "CP51932", "EUC-JIS-2004", "GB12345", "ISO-2022-JP", "ISO-2022-JP-2", "CP50220", "CP50221", "Windows-1256", "Windows-1253", "Windows-1255", "Windows-1254", "TIS-620", "Windows-874", "Windows-1257", "MacJapanese", "UTF-7", "UTF8-MAC", "UTF-16", "UTF-32", "UTF8-DoCoMo", "SJIS-DoCoMo", "UTF8-KDDI", "SJIS-KDDI", "ISO-2022-JP-KDDI", "stateless-ISO-2022-JP-KDDI", "UTF8-SoftBank", "SJIS-SoftBank", "BINARY", "CP437", "CP737", "CP775", "IBM850", "CP857", "CP860", "CP861", "CP862", "CP863", "CP864", "CP865", "CP866", "CP869", "CP1258", "Big5-HKSCS:2008", "ebcdic-cp-us", "eucJP", "euc-jp-ms", "EUC-JISX0213", "eucKR", "eucTW", "EUC-CN", "eucCN", "CP936", "ISO2022-JP", "ISO2022-JP2", "ISO8859-1", "ISO8859-2", "ISO8859-3", "ISO8859-4", "ISO8859-5", "ISO8859-6", "CP1256", "ISO8859-7", "CP1253", "ISO8859-8", "CP1255", "ISO8859-9", "CP1254", "ISO8859-10", "ISO8859-11", "CP874", "ISO8859-13", "CP1257", "ISO8859-14", "ISO8859-15", "ISO8859-16", "CP878", "MacJapan", "ASCII", "ANSI_X3.4-1968", "646", "CP65000", "CP65001", "UTF-8-MAC", "UTF-8-HFS", "UCS-2BE", "UCS-4BE", "UCS-4LE", "CP932", "csWindows31J", "SJIS", "PCK", "CP1250", "CP1251", "CP1252", "external", "locale"], got ["utf-8"]

      charset => "utf-8"

      ...

    }

  }
在winlogbeat配置文件中,添加飘红编码
output.logstash:
  # The Logstash hosts
  hosts: ["10.0.0.11:5044"]
  encoding: GB2312
第10章 logstash解耦之消息队列
10.1 示例图

11 .Filebeat overview
filebeat是本地数据的传输者。在你的服务上安装代理,filebeat监听日志目录或指定的日志文件,追踪文件,发送它们到ES或Logstash创建索引。
filebeat是如何工作的:当你启动Filebeat,它开启一个或多个监控进程,查看在本地上你指定的日志文件。对于每一个日志文件,监控进程查明,Filebeat开始收集。每次收集仅读取一个简单日志文件的新增内容并且发送新的日志数据到libbeat,libbeat聚集事件并且发送聚集数据到输出到你在Fiebeat中配置的地方。
对于更多关于监控进程和聚集,查看https://www.elastic.co/guide/en/beats/filebeat/current/how-filebeat-works.html
Filebeat 是一个Beat,并且它是基于libbeat框架,一般关于libbeat的信息和初始化ES,Logstash,Kibana 都包含在 Beats Platform Reference.
11.1 开始Filebeat
开始Filebeat之前,需要安装和配置以下相关产品
- ES存储和索引数据
- Kibana视图
- Logstash插入数据到ES服务
查看 Getting Started with Beats and the Elastic Stack 了解更多信息
安装好Elastic 堆栈,从提示中读取学习如何安装,配置和运行Filebeat
11.2 第一步:安装Filebeat
下载和安装Filebeat,使用命令行的系统,仅介绍Centos
curl -L -O https://artifacts.elastic.co/downloads/beats/filebeat/filebeat-6.2.4-x86_64.rpm

sudo rpm -vi filebeat-6.2.4-x86_64.rpm
win:
- 下载Filebeat zip格式文件从downloads page.
- 解压提取压缩文件到C:Program Files
- 重命名 filebeat-<version>-windows目录为 filebeat
- 以管理员身份打开PS提示符,如果你是XP系统,你需要下载并安装PS
- 对于PS提示,运行以下命令安装Filebeat作为Windows的服务
PS > cd 'C:Program FilesFilebeat'

PS > C:Program filesFilebeat> .install-service-filebeat.ps1
提示:如果脚本不能在系统上执行,你需要设置当前会话的执行策略允许脚本运行,
#例子:
powershell.exe -ExecutionPolicy UnRestriced -File .install-service-fiilebeat.ps1
11.3 配置Filebeat
提示:filebeat模块提供最快获取日志的体验。查看Quick start for common log formats去学习如何获取及使用模块。如果你已经使用Filebeat模块,你可以跳过当前内容,包括到获取的步骤和去 Quick start for common log formats页面
配置Filebeat,编辑配置文件,对于rpm和deb格式,路径为/etc/filebeat/filebeat.yml.至于docker,它位于/usr/share/filebeat/filebeat.yml。对于mac和win,查看归档和解压位置,它们同样有一个叫做filebeat.referenc.yml作为显示不弃用的选项
查看配置文件格式部分在Beat 平台参考配置文件的格式
这里有一个简单的fiebeat 部分的filebeat.yml文件,对于大多数配置文件的选项Filebeat使用默认预定义的值。
filebeat.prospectors:

  -type: log

enabled: true

paths:

  - /var/log/*.log

  # - c:programdataelasticsearchlogs*
配置Filebeat:
- 为你的日志文件定义路径
对于大多数基于Filebeat 配置,你可以使用一个路径定义一个的监听进程。例如:
filebeat.prospectors:

  -type: log

enabled: true

paths:

  - /var/log/*.log
这个例子中的监听进程收集在/var/log/*.log下的所有日志文件,这也就是说Filebeat将收集/var/log/这个目录下所有以.log结尾的文件.所有匹配支持 Golang Glob支持的所有模式
为了获取所有一个预定义级别下的子目录,使用下面的匹配模式 /var/log/*/*.log
这个获取/var/log/下所有子目录的.log文件,它不能获取/var/log自己目录下的日志.当然它不能递归地获取所有子目录下的文件
- 如果直接发送输出到ES(即,不使用Logstash),设置IP地址和端口,Filebeat能发现ES装置。
output.elasticsearch:

         hosts: ["192.168.1.42:9200"]
如果你发送输出到Logstash,确定你的Logstash配置输出 Step 3: Configure Filebeat to use Logstash.
- 如果你计划使用样本Kibana 指示板提示和Filebeat,配置 kibana端点
setup.kibana

         host: "localhost:5601"
host 指运行kibana的机器ip和port,例如,localhost:5601
提示:如果指定路径在端口号之后,你需要引入协议和端口:
- 如果你启用了ES和kibana的保护机制,你需要在你运行命令行启动Filebeat之前配置好指定凭证,如下:
output.elasticsearch:

         hosts: ["myEShost:9200"]

         username: "elastic"

         password: "elastic"

setup.kibana:

         host: "mykibanahost:5601"

         username:"elastic"

         password:"elastic:
kibana的username和password设置可选的,如果你不指定kibana的凭证,Filebeat使用ES 输出的username和password
如果你正计划 set up the Kibana dashboards,用户必须是kibana_user built-in role 或者等价的权力
同样查看凭证机关选项描述在 Set up the Kibana endpoint,和Configure the Elasticsearch output.
启动Filebeat之前,你应当在配置文件中查看配置选项,对于更多信息查看 Configuring Filebeat
11.4 配置Filebeat 来链接Logstash
重点:使用Logstash 像 output一样,你必须对Logstash安装和配置Beats input插件
如果你想使用Logstash去执行额外的进程在数据收集通过Filebeat,你需要配置Fiebeat连接Logstash
要做到这一点,编辑Filebeat配置文件禁用ES输出通过评论,并且开启Logstash输出部分
#---------------------------------------------------------- Logstash output ---------------------------------------------------------------------------------------

output.logstash:

         hosts: ["127.0.0.1:5044"]

         tail_files:true #文件尾监控文件增量内容
hosts选项指定Logstash服务和端口(5044)并且Logstash 已被配置为监听Beats 的连接
对于以上配置,你必须 load the index template into Elasticsearch manually因为自动加载模板的选项只适用于弹性搜索输出
警告:如果配置文件中带有tail_files: true参数,如果有新加入的监听文件且还想使用tail_file生效,需要删除registry目录,win系统上默认是位置是C:ProgramDatafilebeat
11.5 在ES中加载索引模板
在ES中, index templates被用作定义设置和映射确定如何分析字段
推荐Filebeat索引模板文件通过被安装的Filebeat packages。如果你接受在filebeat.yml配置文件定义配置,Filebeat在成功连接ES服务后自动加载模板,如果模板已存在,除非你配置了,否则不会覆盖
你可以禁止自动加载模板或者加载自定义的模板,通过Filebeat配置文件里的配置模板加载项
你也可以设定选项修改索引名称和索引模板
注意:一个连接到ES服务的请求去加载索引模板,如果输出是Logstash,你必须load the template manually.
了解更多信息,参见:
Load the template manually -对于Logstash请求输出
11.5.1 配置模板加载
默认地,Filebeat自动加载推荐的模板文件,field.yml,如果开启了ES输出,你可以修改地filebeat.yml的默认值
- 加载不同的模板
setup.template.name: "your_template_name"

setup.template.fields: "path/to/fileds.yml"
如果模板已存在,它不会覆盖除非你配置Filebeat这样做
- 覆盖已存在的模板
setup.template.overwrite: true
- 禁止自动模板加载
setup.template.enabled: false
如果你禁用了自动模板加载,你需要 load the template manually.
- 修改索引名称
默认地,Filebeat以Filebeat-6.2.4-yyyy.MM.dd写事件索引,'yyyy.MM.dd'是日期当事件是索引时。使用不同的名称,你需要设置ES 输出里的索引选项。你指定的值应当包含 'root name' 加上日期信息。你也需要配置setup.template.name和setuup.template.pattern选项秋匹配新的名称。例如:
output.elasticsearch.index: "customname-%{[beat.version]}-%{yyyy.MM.dd}

setup.template.name: "customname"

setup.template.pattern: "customname-*

setup.dashboard.index: "customname-*"
如果你计划set up the Kibana dashboards,也设置这个选项覆盖索引名在仪表盘和索引匹配
对整个列表的配置参见 Load the Elasticsearch index template
手动加载模板
手动地加载模板,运行和初始命令.连接到ES服务的请求。如果Logstash 输出开启,你需要使用 -E选项 暂时禁止Logstash输出和开启ES服务。下面的例子假设Logstash 输出开启,你能省略 -E 标记 如果ES 服务开启了
如果你连接设置访问凭证的ES 服务,确保你已配置凭证作为描述 Step 2: Configure Filebeat.
如果主机运行Filebeat 没有直接连接到ES服务,参见Load the template manually (alternate method).
加载模板,对你的系统使用适当的命令,此处仅显示win 和Centos的
deb and rpm:

filebeat setup --template -E output.logstash.enabled=false -E 'output.elasticsearch.hosts=["localhost:9200"]'
win:
以管理员身份打印PS提示符,XP系统,自行下载安装PS环境
从PS提示符中,切换到你安装Filebeat的目录,并且运行下面的代码
PS > .filebeat setup --template -E output.logstash.enabled=false.enabled=false -E 'output.elasticsearch.hosts=["localhost:9200"]'
强制kibana 创建新文档
如果你已使用Filebeat到ES 服务的索引数据,这个索引可能包含老的文档。之前你加载模板,你可以删除老的文档从filebeat-*去强制kibana创建新文档,使用下面的命令
deb,rpm,and mac:

curl -XDELETE 'http://localhost:9200/filebeat-*'
win:
PS > Invoke-ResMethod -Method Delete http://localhost:9200/filebeat-*
上面的命令删除所有匹配到filebeat-*的索引,运行这个命令之前,确保删除的索引是匹配的
手动加载模板(代替方法)
如果主机运行Filebeat不能直接连接到ES服务器,你可以导出模板到一个文件,移动它到已有连接的机器,并且手动安装模板文件
1.导出模板文件:
deb and rpm:
filebeat export template > filebeat.template.json
win:
PS> .filebeat.exe export template --es.version 6.2.4 | Out-File -Encoding UTF8 filebeat.template.json
- 安装模板文件:
deb,rpm,and mac:
curl -XPUT -H 'Content-Type:application/json' http://localhost:9200/_template/filebeat-6.2.4 -d@filebeat.tmplate.json
win:
PS > Invoke-RestMethod -Method Put -ContentType "application/json" -InFile filebeat.template.json -Uri http://localhost:9200/_template/filebeat-6.2.4
第五步:初始化Kibana 仪表盘
Filebeat 打包了Kibana的仪表盘,可视化和可视化搜索Filebeat。在使用仪表盘之前,需要创建匹配索引 "filebeat-*",并且加载仪表盘到Kibana。要做到这一点,可以运行安装程序命令 "setup" 或者configure dashboard loading 在配置文件 filebeat.yml中
这需要配置一个Kibana的端点,如果没有配置Kibana,参见configured Filebeat
确保Kibana已运行后再开始这一步,如果你已连接了kibana的安全接口,确保你已配置了凭证在 Step 2: Configure Filebeat.
为了Filebaet 设置Kibana的仪表盘,为你的系统使用适当的命令
deb and rpm:

filebeat setup --dashboards

       mac:

./filebeat setup --dashboards

docker:

docker run docker.elastic.co/beats/filebeat:6.2.4 setup --dashboard
win:
以管理员身份打开PS窗口,XP自行下载PS
进入到Filebeat的安装目录,并且运行
PS> filebeat setup --dashbords
第六步 开始 Filbeat:
在对应的系统平台上使用相对应的命令开启Filebeat。如果ES集群使用了安全连接,请确保你已配置凭证参见 Step 2: Configure Filebeat.
注意:如果在 deb 或 rpm 系统平台上使用 init.d 脚本 开启Filebeat,你不能指定命令行标记(参见 Command reference),为了指定在前台开启Filebeat
deb:

sudo service filebeat.sart


rpm:

sudo service filebeat.sart


docker:

docker run docker.elastic.co/beats/filebeat:6.2.4


mac:

sudo chown root filebeat.yml

sudo ./filebeat -e -c filebeat.yml -d "publish"
以root用户运行FIlebeat,所以你需要修改配置文件的属主,或者运行Filebeat 的 '--strict.perms=false' 参数指定。参见 Config File Ownership and Permissions 在Beat 平台参考
win:
PS c:>Program FilesFilebeat> Start-Service filebeat
默认地,win 日志文件存储在 "c:ProgramDatafilebeatLogs.
Filebeat 现在已经发送日到你定义的输出中
第7步 查看Kibana 仪表盘示例
为了更容易展示Filebeat数据,已创建了Filebeat仪表盘示例,运行 "setup"命令 更容易加载仪表盘
打开仪表盘,发射Kibana web 接口通过5601访问,例如: localhost:5601
在发现页面,确保预定义的 "filebeat-*" 索引匹配是可以被选中
去仪表盘页面并且选中你想打开的仪表盘页面
当你使用 Filebeat modules 这些仪表盘被定义为现成的工作。然而,你也可以使用作为示例,并且 customize它们去满足你的需求,即使你不使用Filebeat模块
使用数据为了填充仪表盘数据,你需要 define ingest node pipelines 或使用Logstash 去解析数据在字段预期中。如果你下在使用Logstash,参见 configuration examples 中的Logstash文档帮助解析日志格式支持仪表盘。
这是一个简单示例Filebeat系统仪表盘
11.6 常见日志快速格式化
Filebeat提供一个预定义模块,大约在5分钟内可以迅速实现部署日志监控解决方案,完整的包含简单仪表盘和数据可视化,这些模块支持常见的日志格式,像Nginx,Apache2,MySQL,可以使用简单的命令运行
这个提示显示你如何运行基本模块,是不需要额外的配置,对于文档细节和全部列表变量模块,参见:Modules.
如果你正在使用日志文件类型是那种不支持Filebeat 模块的,你需要设置并且手工修改Filebeat配置文件参见Getting Started With Filebeat.
11.6.1 先决条件
运行Filebeat模块之前,你需要:
- 安装和配置ES堆栈。参见: Getting Started with Beats and the Elastic Stack.
- 完成Filebeat安装指令描述参见Step 1: Install Filebeat。安装后,返回当前页面
- 安装获取地理节点IP和用户代理插件。这些插件被引入并获取地址位置及浏览器信息,被用作示例仪表盘的可视化变量。你可以在ES家目录下运行以下命令安装插件:
sudo bin/elasticsearch-plugin install ingest-geoip
sudo bin/elasticsearch-plugin install ingest-user-agent
运行以上命令并重启ES服务器
如果你使用Elastic Cloud 接口,你可以从配置页面开启这两个插件
- 在ES服务接收Filebeat数据时验证ES服务和Kibana
11.6.2 运行Filebeat模块
设置和运行Filebeat模块:
- 如果你已开启了ES和Kibana安全验证,你必须在配置文件指定验证,在你运行命令Filebeat之前.示例如下:
output.elasticsearch:

         hosts: ["myEShost:9200"]

         username: "elastic"

         password: "elastic"

setup.kibana:

         hosts: "myKibanahost:5601"

         username: "elastic"

         password: "elastic"
'username'和'password'是对kibana的可先项.如果你没有指定Kibana的验证,Filebeat使用ES的'username'和'password'指定
如果你正在规划 set up the Kibana dashboards,用户必须有kibana_user built-in role 或等价权限
- 运行 'setup' 命令 设置初始的环境。这个命令从可视化数据Kibana加载ES推荐的索引模板和部署示例仪表盘.例如:
./filebeat setup -e
- 启动Filebeat并且使用命令行 --modules 标记指定一个以逗号分隔的你想运行的模块。下面的示例使用 system 模块启动Filebeat(假定你已启动了dashboards):
./filebeat -e --modules system
这个命令关注Filebeat命令行,加载提取管道节点和解析其他日志配置文件的设置
运行多个模块,可以指定逗号分隔模块列表。如下:
./filebeat -e modules system,nginx,mysql
当你启动Filebeat,你应当查看信息指示- Filebeat 已启动的所有可用模块。如下:
2017/08/16 23:39:15.414375 harvester.go:206: INFO Harvester started for file: /var/log/displaypolicyd.stdout.log
如果没能查看到每个日志文件的信息,必须可读,参见Set the path variable 找到如何设置文件路径
注意:
依赖已安装的Filebeat,当你尝试运行Filebeat 模块可能会见到错误相关的文件或权限问题。参见 Config File Ownership and Permissions 在Beats 平台参考 如果你出现了文件属主或权限
当运行Filebeat,在命令行依照规则使用--modules 标记开启模块。在生产环境中,你可能想使用modules.d目录替代。参见Specify which modules to run 了解更多信息
11.6.3 设置可用路径
这个例子假设系统
当前位置
https://www.elastic.co/guide/en/beats/filebeat/current/filebeat-modules-quickstart.html