%%在0-1s的时间内抽取了256个点
n = 0:255;
Fs = 256;
t = n/Fs;
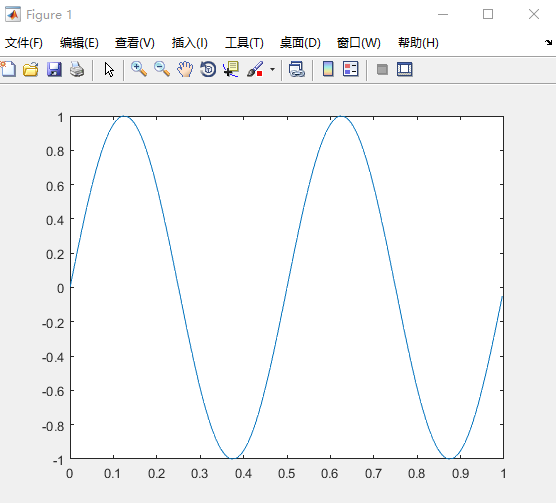
plot(t,sin(2*pi*20*t));
plot(t,sin(2*pi*2*t));
figure; plot(n,sin(2*pi*2*n/Fs));
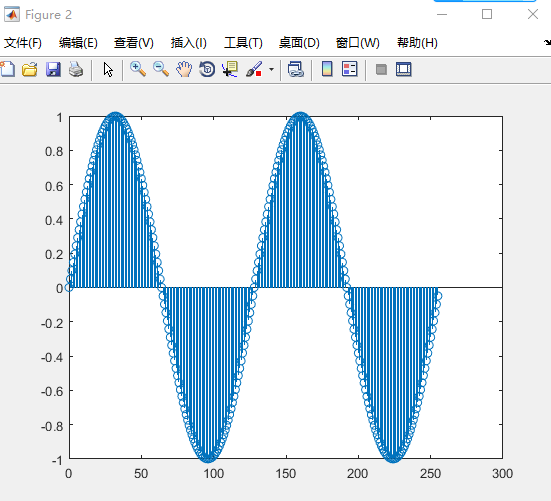
figure;stem(n,sin(2*pi*2*n/Fs));
%%对程序做FFT变换查看
L = 256;
y =5*sin(2*pi*2*n/Fs);
Y = fft(y,Fs);
A = abs(Y);
A = A/(L/2);
A(1) = A(1)/2;
F = (0:L-1)*Fs/L;%频域一个周期Fs抽取点数
figure;
plot(F(1:L/2),A(1:L/2));
title('Amplitude');

从这个之中可以看到FFT之后的频谱图反应的是模拟信号的频率和振幅