https://github.com/peiss/ant-learn-pandas
https://gitee.com/yzw554350785/ant-learn-pandas
https://www.kesci.com/mw/project/59e77a636d213335f38daec2
- 一般
# 中括号的使用
1.取多列
列名要用中括号括起来,所以下述命令
dataframe[['P4_profit_rate','P3PS','P3NS']] 没问题,返回pandas.core.frame.DataFrame类型的值
dataframe['P4_profit_rate','P3PS','P3NS']出错
2.取一列
列名可以不用中括号括起来,
dataframe['P4_profit_rate'] 没问题,返回pandas.core.series.Series类型的值
dataframe[['P4_profit_rate']] 也能正常运行,但返回pandas.core.frame.DataFrame类型的值
# 上代码
re = df_merge[["men_after_on_air"]]  # <class 'pandas.core.frame.DataFrame'>
re = df_merge["men_after_on_air"]    # <class 'pandas.core.series.Series'>


# 数据类型转换
# 1
df_merge = pd.DataFrame(df_merge, dtype=np.float) # 不能转换空数据
# 2
df_merge.loc[:, "mem_after_snapshot2"] = df_merge["mem_after_snapshot"].astype('float') - df_merge["men_before_on_air"].astype('float')
# 3
df_merge.loc[:, "mem_after_snapshot2"] = df_merge["mem_after_snapshot"].map(lambda x: np.float)


# df的合并
#横向-普通
df_merge = pd.merge(left=df_grade, right=df_sinfo, left_on="学号", right_on="学号")
df_merge = pd.merge(df_keyword, df_sentence, how='inner', left_on='keyid', right_on='senid')
df_merge = pd.merge(df_keyword, df_sentence, how='outer', left_on='keyid', right_on='senid')
#横向-笛卡尔积
df_keyword["match"] = 1
df_sentence["match"] = 1
df_merge = pd.merge(df_keyword, df_sentence)
# 自己增加df["one"] = 1后,自己和自己做笛卡尔积
df_merge = pd.merge(left=df, right=df, left_on="one", right_on="one")

#纵向
data_dir = "./datas/crazyant/blog_access_log"
df_list = []
import os
for fname in os.listdir(f"{data_dir}"):
    df_list.append(pd.read_csv(f"{data_dir}/{fname}", sep=" ", header=None, error_bad_lines=False))
df = pd.concat(df_list)


#Pandas按行遍历DataFrame
df = pd.DataFrame(
    np.random.random(size=(100000, 4)),
    columns=list('ABCD')
)
for A, B in zip(df["A"], df["B"]):
    print(A, B)
    break


# 去重和排序
df.sort_values(by = ['invest'], ascending = [False])
df.groupby(['所在省市']).count().reset_index().sort_values(by=['序号'], ascending=[False]).reset_index()
X.drop_duplicates().sort_values(by=["A", "B"])


# 常用数据选取
df2 = tmp2.loc[(tmp2["所在省市"].str.contains('江苏') ) & (tmp2["主管部门"] == '教育部'), :]
df3 = tmp2.groupby(['所在省市','主管部门']).count().reset_index()
df4 = tmp2.loc[(tmp2["主管部门"] == '教育部'), :].groupby(['所在省市']).count().reset_index()
# 根据上面理解下面的loc选取原则
data.loc['a'] #取索引为'a'的行
data.loc[:,['A']] #取'A'列所有行,多取几列格式为 data.loc[:,['A','B']]

# 使用区别(见画图相关)
df.stack().reset_index()
df3 = df1.melt('I', var_name='var', value_name='value')

# 原df中取新的df
sub_df = stocks[['收盘', '开盘', '高', '低', '交易量']]


# 替换掉温度的后缀℃
df.loc[:, "bWendu"] = df["bWendu"].str.replace("℃", "").astype('int32')  #【str】str是series的属性,datafram没有
# 1. 字符串截取,方便显示
df.loc[:, "error_msg_short"] = df["error_msg"].str[0:60]

# 2. 报错原因:DataFrame.apply(function), 函数的参数是Series,Series的["error_msg"]已经是字符串了 (重点记忆)
def get_short(df):
    # return df["error_msg"].str[0:60] //报错,'str' object has no attribute 'str'
    return df["error_msg"][0:60]
#  Series.apply(function), 函数的参数是每个值,返回值是一个值; DataFrame.apply(function), 函数的参数是Series,返回值是Series列
df.loc[:, "error_msg_short"] = df.apply(get_short, axis=1)

# 3. apply应用df,返回Series
df['rru_vesion']= df.apply(lambda x: 'build:'+x['rru_vesion'].split(';')[0].split(":")[1] if x['rru_vesion']!='null' else 'no build', axis=1)


#交换列
read_data=read_data.loc[:,['缴费日期','用户编号','缴费金额(元)']]  # 缴费日期放到用户编号前面
# 原理:
# Series
s1 = pd.Series(np.random.randn(6), index=list('abcdef')) # 定义了一个包含6个随机数的pandas.Series,这6个数的索引标签分别是abcdef 这6个字符
s1.loc['b']      # 我们可以通过索引标签来获取我们想要获取的数据
s1.loc['b':'f']  # 通过一个标签切片(a slice objects with labels)来获取多个数据也可以进行赋值,切片用法和Python原生的list的切片是不一样的,冒号两边的start和stop位置都被包含了进来
# DataFrame
df1 = pd.DataFrame(np.random.randn(6, 4),index=list('abcdef'),columns=list('ABCD'))  # 在pandas的DataFrame中.loc方法并没有很大区别
df1 # 所有
df1.loc[['a', 'b', 'd'], :] # abc 三行,所有列
df1.loc['d':, 'A':'C'] # d行,A到C列
df1.loc['a']  #只是a一行,【注意显示的时候是纵向的,不要混淆了】


# index 替换
df.set_index(pd.to_datetime(df["time"]),inplace=True)
df.set_index("time",inplace=True)


#修改列名
df1.rename(columns={'a':'A'}) #a->A ,返回新的数据
df2.columns # 重要:先看看,可能前面有空格,会导致rename不成功
df2.rename(columns={'a':'A', 'b':'B'}, inplace = True)  # 修改原数据


# 修改替换掉温度的后缀℃
df.loc[:, "bWendu"] = df["bWendu"].str.replace("℃", "").astype('int32')


# 统计信息
df.describe()      # 一下子提取所有数字列统计结果
print(df.describe())
print(df.dtypes)
print(df.info())
stocks["公司"].unique()  # 唯一性去重,一般不用于数值列,而是枚举、分类列
df["tianqi"].value_counts() # 按值计数
df.count()
df.cov() # 协方差矩阵
df.corr() # 相关系数矩阵
df["is_spider"].value_counts() #方法1
df.groupby("status").size()    #方法2
# 数据类型信息
print(df_merge[["mem_after_snapshot"]].dtypes)
print(df_merge[["mem_after_snapshot"]].info())


#取列  //推荐 df.loc[:,'time']
# 以下用法相等(用于取列)
df['time']
df.time
df.loc[:,'time']  //推荐
data.icol(0)

df.loc[:,['age','date']] #多列1
df[['age','date']]       #多列2
print(sample_data3.df[['throughputd','throughputu']])
cols = ['Fail', 'PASS']
X = df.loc[:, cols]
#实际遇到问题
df2.loc[:,'result']   //显示不是想要的
df2.loc[:,['result']] //显示想要的df


#取行  //推荐 df.loc[0:2]
df.loc[1:2] # 第1行
df.loc[0:2] # 前2行  //推荐
df.loc[0,:] # 第0行
#根据索引取行,注意里面是列表
df.loc[['index1','index2'],:]

#取前面几行
df.head(10)
df[0:10]


#两种用法的区别
data = np.array(xxx)
data[0,:] #ok
data = [1,2,3,4,5]
# 学习:里面这种python会认为传入的是tuple 类型
a[0,:]  # list indices must be integers or slices, not tuple ,

data.head()
data.tail()
data.irow(0)
df.sort_values(by="bWendu")[["ymd", "bWendu"]][-topn:]
#分层索引MultiIndex
ser.loc[('BIDU', '2019-10-02')]
#条件
df2 = tmp2.loc[(tmp2["所在省市"].str.contains('江苏') ) & (tmp2["主管部门"] == '教育部'), :]
#正则表达 contains和match 区别
AEQV_PR = df2.iloc[df2.index.get_level_values(1).str.contains('PR\d{6}:')]
AEQE_PR = df1.iloc[df1.index.get_level_values(1).str.match('PR\d{6}:')]
# index contains取行的方法
AEQV_PR = df2.iloc[df2.index.get_level_values(1).str.contains('PR\d{6}:')]
- 查询
# 查看温度类型的计数
df["wendu_type"].value_counts()


# 得到单个值
df.loc['2018-01-03', 'bWendu']

# 得到一个Series
df.loc['2018-01-03', ['bWendu', 'yWendu']]
# 得到DataFrame
df.loc[['2018-01-03','2018-01-04','2018-01-05'], ['bWendu', 'yWendu']]

# 查询最高温度小于30度,并且最低温度大于15度,并且是晴天,并且天气为优的数据
df.loc[(df["bWendu"]<=30) & (df["yWendu"]>=15) & (df["tianqi"]=='晴') & (df["aqiLevel"]==1), :]
df[(df["bWendu"]<=30) & (df["yWendu"]>=15) & (df["tianqi"]=='晴') & (df["aqiLevel"]==1)]

# 直接写lambda表达式
df.loc[lambda df : (df["bWendu"]<=30) & (df["yWendu"]>=15), :]

# 编写自己的函数,查询9月份,空气质量好的数据
def query_my_data(df): #参数是df
    return df.index.str.startswith("2018-09") & (df["aqiLevel"]==1)

df.loc[query_my_data, :]

# 编写自己的函数2
def match_func(row): #参数是Series
    return re.search(row["keyword"], row["sentence"], re.IGNORECASE) is not None

df_merge[df_merge.apply(match_func, axis=1)]
3a. 增加-列
# 1
# 注意,df["bWendu"]其实是一个Series,后面的减法返回的是Series
df.loc[:, "wencha"] = df["bWendu"] - df["yWendu"]
df["wencha"] = df["bWendu"] - df["yWendu"]

# 2
def get_wendu_type(x):
    if x["bWendu"] > 33:
        return '高温'
    if x["yWendu"] < -10:
        return '低温'
    return '常温'

# 注意需要设置axis==1,这是series的index是columns
df.loc[:, "wendu_type"] = df.apply(get_wendu_type, axis=1)


# 3
# 可以同时添加多个新的列
df.assign(
    yWendu_huashi = lambda x : x["yWendu"] * 9 / 5 + 32,
    # 摄氏度转华氏度
    bWendu_huashi = lambda x : x["bWendu"] * 9 / 5 + 32
)


# 4
# 先创建空列(这是第一种创建新列的方法)
df['wencha_type'] = ''
df.loc[df["bWendu"]-df["yWendu"]>10, "wencha_type"] = "温差大"
df.loc[df["bWendu"]-df["yWendu"]<=10, "wencha_type"] = "温差正常"

# 5
s1 = pd.Series(list(range(4)), name="F")
s2 = df1.apply(lambda x:x["A"]+"_GG", axis=1)
s2.name="G"
pd.concat([df1,s1,s2], axis=1) # 添加多列
3b. 增加-行
#1
df1 = pd.DataFrame([[1, 2], [3, 4]], columns=list('AB'))
df2 = pd.DataFrame([[5, 6], [7, 8]], columns=list('AB'))
df1.append(df2)

#2
df = df1+df2 #这样是把里面的内容相加

#3
df_merged = pd.concat(df_list)  # df_list是DataFrame列表,concat可以合并列表
- 空处理
studf.isnull()

# 筛选没有空分数的所有行
studf.loc[studf["分数"].notnull(), :]

# 删除掉全是空值的列
studf.dropna(axis="columns", how='all', inplace=True)

# 以下用法相等
studf.fillna({"分数":0})  #只适用于列
studf.loc[:, '分数'] = studf['分数'].fillna(0)

# 将姓名的缺失值填充,使用前面的有效值填充,用ffill:forward fill
studf.loc[:, '姓名'] = studf['姓名'].fillna(method="ffill")
- 时间处理
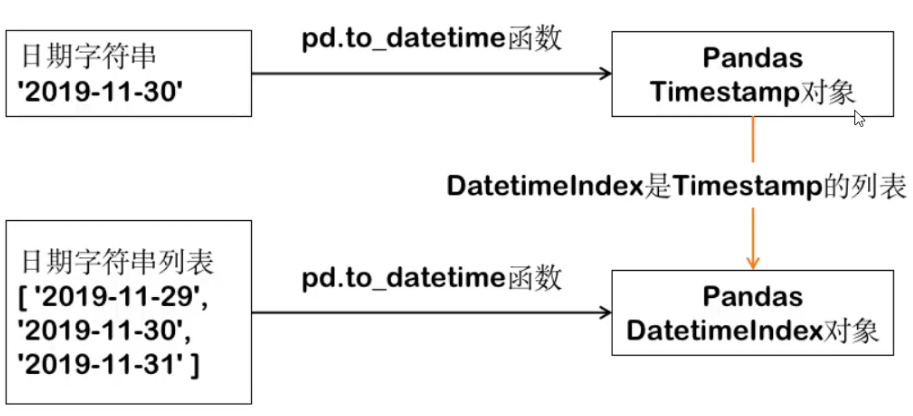
# 将日期列转换成pandas的日期
https://pandas.pydata.org/pandas-docs/stable/user_guide/timeseries.html#time-date-components

df_new2 = df.set_index(pd.to_datetime(df["pdate"])).drop("pdate", axis=1) #原来的那一列(axis=1)不要了
df_new2 = df.set_index(pd.to_datetime(df["pdate"]), inplace=True) # 返回值是空,原来额df改变 ,df_new2 是空的请注意
df_new2 = df_date.set_index(pd.to_datetime(df_date.index)) # index是日期类型的str
#不标准的时间转换成标标准的,[02/Dec/2019:22:40:18
df["stime"] = pd.to_datetime(df["stime"].str[1:], format="%d/%b/%Y:%H:%M:%S")


# df.loc['2020-11-02':'2020-11-08']
# df.loc['2020-11']
df.loc['2020-11'].index
# df.truncate(after='2020-11-06')
df.index.week  #一年的第几周

# 按周统计并且画图
%matplotlib inline
df.groupby(df.index.week)["bWendu"].max().head()
df.groupby(df.index.week)["bWendu"].max().plot()
# df.loc[:,'throughput'].plot()
df.plot()


# 一星期前
week_ago = datetime.date.today() - datetime.timedelta(days=7)
# before the truncate function in order to fix the error in later versions of Pandas
df = df.sort_index() or  df = df.sort_values()
df.truncate(before=week_ago)


# DatetimeIndex,时间类型索引,功能强大
#时间缺失的问题
pdates = pd.date_range(start="2019-12-01", end="2019-12-05")  # 生成完整的日期序列
df_date_new = df_date.reindex(pdates, fill_value=0) #没有时间的地方填写0


#很多数据如果是时间索引可以方便进行重新采样
# 按小时统计
df_pvuv = df.resample("H")["ip"].agg(pv=np.size, uv=pd.Series.nunique)
# 按每6个小时统计
df_pvuv = df.resample("6H")["ip"].agg(pv=np.size, uv=pd.Series.nunique)
# 按天统计
df_pvuv = df.resample("D")["ip"].agg(pv=np.size, uv=pd.Series.nunique)


# 显示时间相关
# 显示的时候2020-10-10 12:12:12 转 2020-10-10
df['CreateTime'] = df['CreateTime'].dt.date
# 显示的时候2020-10-10 12:12:12 转 20201010
df['CreateTime'] = df['CreateTime'].dt.strftime('%Y%m%d')
# 函数的方法
dates = pd.to_datetime(pd.Series(['20010101', '20010331']), format='%Y%m%d')
dates.apply(lambda x: x.strftime('%Y-%m-%d'))
- Series转换为DataFrame
# 画图1
# df
df.loc[:,'throughput'].plot()


# 画图2
ds = df.loc[:,'throughput']
ds
# 方法1
# df = ds.to_frame()  # 当Series的index也需要转变为DataFrame的一列时,这个方法转换会有一点问题
# df
# 方法2 OK
df = df.loc[:,'throughput'].reset_index()
# df
# 方法3 OK
df ={'time':ds.index,'throughput':ds.values}
df = pd.DataFrame(df)
df


alt.Chart(df).mark_line().encode(
    x='time',
#     y='Run Time',
    y=alt.Y('throughput')
#     color='Origin'
).properties(width=500,height=500).interactive()
- 字符串相关的操作
# 官方文档
https://pandas.pydata.org/pandas-docs/stable/reference/series.html

# str是series的属性,datafram没有

# 每次调用函数,都返回一个新Series
df["ymd"].str.replace("-", "").slice(0, 6)  # 报错
df["ymd"].str.replace("-", "").str.slice(0, 6) #正确


# 添加新列 apply的用法 ,类似于filer函数
# axis=1 跨列的理解
def get_nianyueri(x):
    year,month,day = x["ymd"].split("-")
    return f"{year}年{month}月{day}日"
df["中文日期"] = df.apply(get_nianyueri, axis=1)

#怎样将“2018年12月31日”中的年、月、日三个中文字符去除?
df["中文日期"].str.replace("[年月日]", "")
- 合并/拆分相关
# 如果出现非Key的字段重名
pd.merge(left, right, on='key', suffixes=('_left', '_right'))

# df_list是DataFrame列表,concat可以合并列表
df_merged = pd.concat(df_list)

# iloc拆分行
df_sub = df_source.iloc[begin:end]
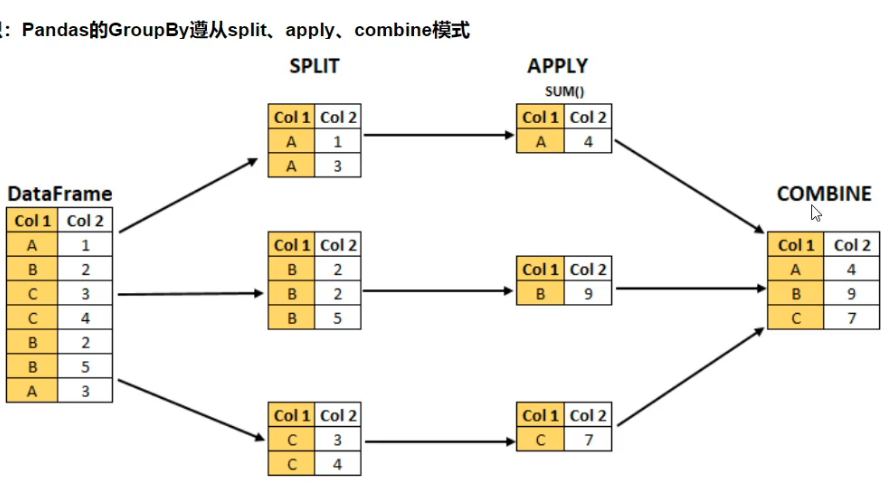
- groupby使用
Pandas的GroupBy遵从split、apply、combine模式
df.groupby('A').sum()  # A列分组后,显示多列的sum统计

df.groupby(['A','B']).mean()                  # A列分组
df.groupby(['A','B'], as_index=False).mean()  #不是A作为index

# agg用法
df.groupby('A').agg([np.sum, np.mean, np.std]) # 列变成了多级索引
df.groupby('A')['C'].agg([np.sum, np.mean, np.std])  #方法1 ,c的统计结果
df.groupby('A').agg([np.sum, np.mean, np.std])['C'] #方法2 ,c的统计结果
df.groupby('A').agg({"C":np.sum, "D":np.mean})  #传入字典,不同的列使用不同的函数
#结合画图
group_data = df.groupby('month').agg({"bWendu":np.max, "yWendu":np.min, "aqi":np.mean})
group_data.plot()

#理解groupby
g = df.groupby('A')   # <pandas.core.groupby.generic.DataFrameGroupBy object at 0x00000123B250E548>
for name,group in g:
    print(name)
    print(group)
    print()


#对每个分组应用apply函数
# 实现按照用户ID分组,然后对其中一列归一化
def ratings_norm(df):
    """
    @param df:每个用户分组的dataframe
    """
    min_value = df["Rating"].min()
    max_value = df["Rating"].max()
    df["Rating_norm"] = df["Rating"].apply(
        lambda x: (x-min_value)/(max_value-min_value))
    return df

ratings = ratings.groupby("UserID").apply(ratings_norm)


# 对应的sql
df.loc[df['result']=='fail',:].groupby(['error_msg']).count().sort_values(by = ['result'], ascending = [False])
select count(result) as i,error_msg  from report_reportdetail where result = 'fail' group by error_msg order by i desc ;
- 多层索引
#Series的分层索引MultiIndex
ser = stocks.groupby(['公司', '日期'])['收盘'].mean()
# 1 unstack把二级索引变成列
ser.unstack()
# 2
ser.reset_index()

#筛选数据
ser.loc['BIDU']
ser.loc[:, '2019-10-02']
##多层索引,可以用元组的形式筛选
ser.loc[('BIDU', '2019-10-02')]


#DataFrame的多层索引MultiIndex
#变成多层索引
stocks.set_index(['公司', '日期'], inplace=True)
stocks.sort_index(inplace=True)
# 指定index为两层
df=pd.DataFrame(np.arange(16).reshape((4,4)),index=[['a','b','c','d'],['A','B','C','D']],columns=['one','two','three','four'])


#筛选数据
'''
    元组(key1,key2)代表筛选多层索引,其中key1是索引第一级,key2是第二级,比如key1=JD, key2=2019-10-02
    列表[key1,key2]代表同一层的多个KEY,其中key1和key2是并列的同级索引,比如key1=JD, key2=BIDU
'''
stocks.loc['BIDU']
stocks.loc[('BIDU', '2019-10-02'), :]
stocks.loc[['BIDU', 'JD'], :]
stocks.loc[(['BIDU', 'JD'], '2019-10-03'), '收盘']
# slice(None)代表筛选这一索引的所有内容
stocks.loc[(slice(None), ['2019-10-02', '2019-10-03']), :]


# 变成多层索引 - MultiIndex
# 1
multi = df.set_index(['Film', 'Chapter', 'Race', 'Character'])
multi.sort_index  #重要,看上去明显有层次

# 2
arrays = [['bar', 'bar', 'baz', 'baz', 'foo', 'foo', 'qux', 'qux'],
          ['one', 'two', 'one', 'two', 'one', 'two', 'one', 'two']]
index = pd.MultiIndex.from_arrays(arrays, names=['first', 'second'])
s = pd.Series(np.random.randn(8), index=index)
- map、apply、applymap
'''

    map:只用于Series,实现每个值->值的映射;
    apply:用于Series实现每个值的处理,用于Dataframe实现某个轴的Series的处理;
    applymap:只能用于DataFrame,用于处理该DataFrame的每个元素;

'''
# 1
# map 只用于Series,实现每个值->值的映射;
dict_company_names = {
    "bidu": "百度",
    "baba": "阿里巴巴",
    "iq": "爱奇艺",
    "jd": "京东"
}
stocks["公司中文1"] = stocks["公司"].str.lower().map(dict_company_names)
stocks["公司中文2"] = stocks["公司"].map(lambda x : dict_company_names[x.lower()]) # 返回的是Series


# 2
# apply
'''
    Series.apply(function), 函数的参数是每个值,返回值是一个值
    DataFrame.apply(function), 函数的参数是Series,返回值是Series列
'''
# Series.apply(function),function的参数是Series的每个值
stocks["公司中文3"] = stocks["公司"].apply(lambda x : dict_company_names[x.lower()])  # 用于Series和map类似

# DataFrame.apply(function),function的参数是对应轴的Series
'''注意这个代码:
1、apply是在stocks这个DataFrame上调用;
2、lambda x的x是一个Series,因为指定了axis=1所以Seires的key是列名,可以用x['公司']获取
'''
stocks["公司中文4"] = stocks.apply(lambda x : dict_company_names[x["公司"].lower()], axis=1)

# 编写自己的函数2
def match_func(row): #参数是Series
    return re.search(row["keyword"], row["sentence"], re.IGNORECASE) is not None

df_merge[df_merge.apply(match_func, axis=1)]


# 3
# applymap
# applymap,只能用于DataFrame,用于处理该DataFrame的每个元素;
# 将这些数字取整数,应用于所有元素
sub_df.applymap(lambda x : int(x))


# 4 应用
#实际应用,获取版本号
df = pd.DataFrame({
    "pdate": ["BUILD_NUMBER:1501; TAR is: TRM-1.tar",
              "BUILD_NUMBER:1502; TAR is: TRM-2.tar",
              "BUILD_NUMBER:1503; TAR is: TRM-3.tar",
              "BUILD_NUMBER:1504; TAR is: TRM-4.tar"],
    "pv": [100, 200, 400, 500],
    "uv": [10, 20, 40, 50],
})

#方法1【Series的str】
df1 = df['pdate'].str.split(pat=";",expand=True)[0]
df1 # BUILD_NUMBER:1501

#方法2【apply】
f = lambda x: 'build:'+x['pdate'].split(';')[0].split(":")[1]    # 函数的参数是Series,返回值是Series列
df2 = df.apply(f, axis=1)
df2  # build:1501
- stack和pivot实现数据透视
# df.unstack()  # columns的name变成index
# df.stack()    # 列变索引

# unstack
df_group = df.groupby([df["pdate"].dt.month, "Rating"])["UserID"].agg(pv=np.size)
df_stack = df_group.unstack()

# unstack
df_reset = df_group.reset_index()
df_pivot = df_reset.pivot("pdate", "Rating", "pv")


#多层索引画图需要用到unstack
import pandas as pd
#多层索引
df=pd.DataFrame(np.arange(1,5).reshape((4,1)),index=[['a','b','c','d'],['A','B','C','D']],columns=['data',])

# 可有可无的设置index名称
df=df.rename_axis(index=['index1', 'index2'])

#转换成一层索引
df=df.reset_index()

#再次变成 多层索引
df.set_index(['index1', 'index2'], inplace=True)

# columns的name变成index
plt = df.unstack(fill_value=0)['data']
plt.rename(columns={'A':'aa', 'B':'b', 'C':'c'}, inplace = True)
plt
- excel操作
df_grade = pd.read_excel("./course_datas/c23_excel_vlookup/学生成绩表.xlsx")
df_sinfo = pd.read_excel("./course_datas/c23_excel_vlookup/学生信息表.xlsx")
# 只筛选第二个表的少量的列
df_sinfo = df_sinfo[["学号", "姓名", "性别"]]
#默认内连接
df_merge = pd.merge(left=df_grade, right=df_sinfo, left_on="学号", right_on="学号")

# 将'姓名', '性别'两列,放到'学号'的后面
# 将columns变成python的列表形式
new_columns = df_merge.columns.to_list()
# 按逆序insert,会将"姓名","性别"放到"学号"的后面
for name in ["姓名", "性别"][::-1]:
    new_columns.remove(name)
    new_columns.insert(new_columns.index("学号")+1, name)

df_merge = df_merge.reindex(columns=new_columns)
df_merge.to_excel("./course_datas/c23_excel_vlookup/合并后的数据表.xlsx", index=False)


# 合并文件夹下面多个excel,excel里面还有多个sheet
dfs = []
for fname in os.listdir("./"):
      if fname.endswith(".xls"):
            df = pd.read_excel(
                  fname,
                  header =None,
                  sheet_name =None
            )
            dfs.extend(df.values())
result = pd.concat(dfs)
- 数据归一化 (Pandas怎样对每个分组应用apply函数?)
#电影评分数据归一化
#Pandas怎样对每个分组应用apply函数?
#知识:Pandas的GroupBy遵从split、apply、combine模式

def ratings_norm(df):
    """
    @param df:每个用户分组的dataframe
    """
    min_value = df["Rating"].min()
    max_value = df["Rating"].max()
    df["Rating_norm"] = df["Rating"].apply(
        lambda x: (x-min_value)/(max_value-min_value))
    return df

ratings = ratings.groupby("UserID").apply(ratings_norm)