【MySQL】企业级监控解决方案Promethus+Grafana
Promethus用作监控数据采集与处理,而Grafana只是用作数据展示
一、Promethus简介
Prometheus(普罗米修斯)是一套开源的监控&报警&时间序列数据库的组合,起始是由SoundCloud公司开发的。随着发展,越来越多公司和组织接受采用Prometheus,社区也十分活跃,他们便将它独立成开源项目,并且有公司来运作。Google SRE的书内也曾提到跟他们BorgMon监控系统相似的实现是Prometheus。现在最常见的Kubernetes容器管理系统中,通常会搭配Prometheus进行监控。
Prometheus基本原理是通过HTTP协议周期性抓取被监控组件的状态,这样做的好处是任意组件只要提供HTTP接口就可以接入监控系统,不需要任何SDK或者其他的集成过程。这样做非常适合虚拟化环境比如VM或者Docker 。
Prometheus应该是为数不多的适合Docker、Mesos、Kubernetes环境的监控系统之一。
输出被监控组件信息的HTTP接口被叫做exporter 。目前互联网公司常用的组件大部分都有exporter可以直接使用,比如Varnish、Haproxy、Nginx、MySQL、Linux 系统信息 (包括磁盘、内存、CPU、网络等等),具体支持的源看:https://github.com/prometheus
与其他监控系统相比,Prometheus的主要特点是:
一个多维数据模型(时间序列由指标名称定义和设置键/值尺寸)。
非常高效的存储,平均一个采样数据占~3.5bytes左右,320万的时间序列,每30秒采样,保持60天,消耗磁盘大概228G。
一种灵活的查询语言。
不依赖分布式存储,单个服务器节点。
时间集合通过HTTP上的PULL模型进行。
通过中间网关支持推送时间。
通过服务发现或静态配置发现目标。
多种模式的图形和仪表板支持。
二、Promethus原理

基本原理就是这样:
exporter作为数据采集器部署在被监控端,暴露一个http接口给server端抓取数据
Promethus Server通过接口去每个exporter上抓取监控数据
实际上也可以通过pushgateway将监控数据主动推送给服务端
服务端存入监控数据,以K/V形式存储,并将报警推送给Alertmanager实现报警
三、安装Promethus
服务端安装:
1、安装go环境
配置阿里yum源
[root@mydb1 ~]# wget -O /etc/yum.repos.d/CentOS-Base.repo http://mirrors.aliyun.com/repo/Centos-7.repo
[root@mydb1 ~]# yum install -y go
2、安装prometheus
[root@mydb1 soft]# tar xvf prometheus-2.3.2.linux-amd64.tar.gz
[root@mydb1 soft]# mv prometheus-2.3.2.linux-amd64 /usr/local/prometheus
3、编辑配置文件
[root@mydb1 ~]# cat /usr/local/prometheus/prometheus.yml
# my global config
global:
scrape_interval: 15s
evaluation_interval: 15s
scrape_configs:
- job_name: 'prometheus'
static_configs:
- targets: ['192.168.1.101:9090']
labels:
instance: prometheus
- job_name: Linux-Server
static_configs:
- targets: ['192.168.1.101:9100']
labels:
instance: mydb1
- targets: ['192.168.1.102:9100']
labels:
instance: mydb2
- targets: ['192.168.1.103:9100']
labels:
instance: mydb3
- job_name: Mysql-Server
static_configs:
- targets: ['192.168.1.101:9104']
labels:
instance: mysql1
- targets: ['192.168.1.102:9104']
labels:
instance: mysql2
- targets: ['192.168.1.103:9104']
labels:
instance: mysql3
4、启动promethus
[root@mydb1 ~]# /usr/local/prometheus/prometheus --config.file=/usr/local/prometheus/prometheus.yml --storage.tsdb.path="/data/prometheus" --storage.tsdb.retention=30d &
config.file:指定配置文件
storage.tsdb.path:指定监控数据存放目录
storage.tsdb.retention:指定保留30天监控数据
5、查看状态
登陆ip:9090可以看到promethus自带的web界面,可以自己写类SQL查询数据,点击status可以看到节点的exporter的状态
客户端安装
1、安装node_exporter和mysqld_exporter
[root@mydb1 soft]# tar xvf node_exporter-0.16.0.linux-amd64.tar.gz
[root@mydb1 soft]# mv node_exporter-0.16.0.linux-amd64 /usr/local/node_exporter
[root@mydb1 soft]# tar xvf mysqld_exporter-0.11.0.linux-amd64.tar.gz
[root@mydb1 soft]# mv mysqld_exporter-0.11.0.linux-amd64 /usr/local/mysqld_exporter
[root@mydb2 soft]# tar xvf node_exporter-0.16.0.linux-amd64.tar.gz
[root@mydb2 soft]# mv node_exporter-0.16.0.linux-amd64 /usr/local/node_exporter
[root@mydb2 soft]# tar xvf mysqld_exporter-0.11.0.linux-amd64.tar.gz
[root@mydb2 soft]# mv mysqld_exporter-0.11.0.linux-amd64 /usr/local/mysqld_exporter
[root@mydb3 soft]# tar xvf node_exporter-0.16.0.linux-amd64.tar.gz
[root@mydb3 soft]# mv node_exporter-0.16.0.linux-amd64 /usr/local/node_exporter
[root@mydb3 soft]# tar xvf mysqld_exporter-0.11.0.linux-amd64.tar.gz
[root@mydb3 soft]# mv mysqld_exporter-0.11.0.linux-amd64 /usr/local/mysqld_exporter
2、启动node_exporter
主要采集系统层面的监控数据
[root@mydb1 ~]# /usr/local/node_exporter/node_exporter &
[root@mydb2 ~]# /usr/local/node_exporter/node_exporter &
[root@mydb3 ~]# /usr/local/node_exporter/node_exporter &
3、启动mysqld_exporter
主要采集mysql层的监控数据
mydb1,mydb2,mydb3都执行
创建监控账号
GRANT REPLICATION CLIENT,PROCESS,SELECT ON *.* TO 'mysql_monitor'@'192.168.1.%' identified by 'mysql_monitor';
创建配置文件
[root@mydb1 ~]# cat /usr/local/mysqld_exporter/.my.cnf
[client]
host=192.168.1.101
user=mysql_monitor
password=mysql_monitor
[root@mydb2 ~]# cat /usr/local/mysqld_exporter/.my.cnf
[client]
host=192.168.1.102
user=mysql_monitor
password=mysql_monitor
[root@mydb2 ~]# cat /usr/local/mysqld_exporter/.my.cnf
[client]
host=192.168.1.103
user=mysql_monitor
password=mysql_monitor
[root@mydb1 ~]# /usr/local/mysqld_exporter/mysqld_exporter --config.my-cnf="/usr/local/mysqld_exporter/.my.cnf" &
[root@mydb2 ~]# /usr/local/mysqld_exporter/mysqld_exporter --config.my-cnf="/usr/local/mysqld_exporter/.my.cnf" &
[root@mydb3 ~]# /usr/local/mysqld_exporter/mysqld_exporter --config.my-cnf="/usr/local/mysqld_exporter/.my.cnf" &
5、web界面测试数据获取
http://localhost:9090

四、安装Grafana
1、上传rpm包,直接安装即可
[root@mydb1 soft]# rpm -ivh grafana-5.2.1-1.x86_64.rpm
[root@mydb1 ~]# systemctl start grafana-server.service
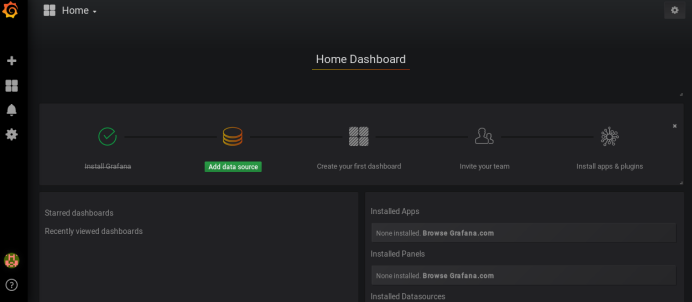
2、登陆web界面
登陆ip:3000,首次登陆初始账号密码都是admin,会提示修改密码。修改后admin/hgc3177678

3、配置数据源

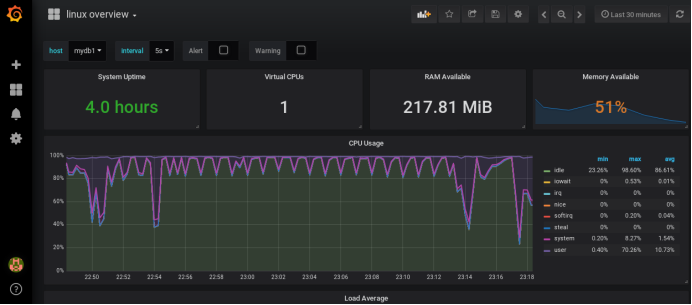
4、导入模板
解压grafana-dashboards包,该包中提供了大量的json格式文件的grafana dashboards,根据需要自行选择,https://github.com/percona/grafana-dashboards
linux_overview-1531814759712.json
MySQL_Overview-1531814739662.json
MySQL_InnoDB_Metrics-1531814772539.json
MySQL_Replication-1531814749684.json

效果图如下

【MySQL】Promethus监控报警-AlertManager
Promethus通过AlertManager实现报警
一、安装AlertManager
AlertMnager安装方式基本同exporter,解压,修改配置文件,启动即可,下载地址:https://github.com/prometheus/alertmanager/releases/download/v0.15.1/alertmanager-0.15.1.linux-amd64.tar.gz
[root@mydb1 soft]# tar xvf alertmanager-0.15.1.linux-amd64.tar.gz
[root@mydb1 soft]# mv alertmanager-0.15.1.linux-amd64 /usr/local/alertmanager
二、配置文件
[root@mydb1 ~]# cat /usr/local/alertmanager/alertmanager.yml
global:
smtp_smarthost: 'smtp.163.com:25'
smtp_from: 'hugaochao320@163.com'
smtp_auth_username: 'hugaochao320@163.com'
smtp_auth_password: 'hgc3177678'
smtp_require_tls: false
templates:
- '/usr/local/alertmanager/template/*.tmpl'
route:
group_by: ['alertname']
group_wait: 10s
group_interval: 10s
repeat_interval: 1m
receiver: 'hugc'
receivers:
- name: 'hugc'
email_configs:
- to: 'hugc@knowbox.cn'
html: '{{ template "alert.html" . }}'
headers: { Subject: " {{ .CommonAnnotations.summary }}" }
三、告警规则
[root@mydb1 ~]# cat /usr/local/prometheus/rules/memory_over.yml
groups:
- name: NodeMemoryUsage
rules:
- alert: NodeMemoryUsage
expr: round((node_memory_MemTotal_bytes - (node_memory_MemFree_bytes+node_memory_Buffers_bytes+node_memory_Cached_bytes )) / node_memory_MemTotal_bytes * 100) > 80
for: 1m
labels:
user: xucl
annotations:
summary: "{{$labels.instance}}: High Memory usage detected"
description: "{{$labels.instance}}: Memory usage is above 80% (current value is:{{ $value }})"
value: "{{ $value }}"
[root@mydb1 ~]# cat /usr/local/prometheus/rules/node_down.yml
groups:
- name: InstanceDown
rules:
- alert: InstanceDown
expr: up == 0
for: 1m
labels:
user: xucl
annotations:
summary: "Instance {{ $labels.instance }} down"
description: "{{ $labels.instance }} of job {{ $labels.job }} has been down for more than 1 minutes."
四、修改promethus配置文件
在原先的promethus.yml最后增加
[root@mydb1 ~]# cat /usr/local/prometheus/prometheus.yml
# my global config
global:
scrape_interval: 15s
evaluation_interval: 15s
scrape_configs:
- job_name: 'prometheus'
static_configs:
- targets: ['192.168.1.101:9090']
labels:
instance: prometheus
- job_name: Linux-Server
static_configs:
- targets: ['192.168.1.101:9100']
labels:
instance: mydb1
- targets: ['192.168.1.102:9100']
labels:
instance: mydb2
- targets: ['192.168.1.103:9100']
labels:
instance: mydb3
- job_name: Mysql-Server
static_configs:
- targets: ['192.168.1.101:9104']
labels:
instance: mysql1
- targets: ['192.168.1.102:9104']
labels:
instance: mysql2
- targets: ['192.168.1.103:9104']
labels:
instance: mysql3
alerting:
alertmanagers:
- static_configs:
- targets: ["localhost:9093"]
rule_files:
- "rules/memory_over.yml"
- "rules/node_down.yml"
五、模板文件
[root@mydb1 ~]# cat /usr/local/alertmanager/template/alert.tmpl
{{ define "alert.html" }}
<style type="text/css">
table
{
border-collapse: collapse;
margin: 0 auto;
text-align: center;
}
table td, table th
{
border: 1px solid #cad9ea;
color: #666;
height: 30px;
}
table thead th
{
100px;
}
table tr:nth-child(odd)
{
background: #fff;
}
table tr:nth-child(even)
{
background: #F5FAFA;
}
</style>
<table width="90%" class="table">
<tr><td>报警项</td>
<td>主机</td>
<td>报警阀值</td>
<td>开始时间</td>
</tr>
{{ range $i, $alert := .Alerts }}
<tr><td>{{ index $alert.Labels "alertname" }}</td>
<td>{{ index $alert.Labels "instance" }}</td>
<td>{{ index $alert.Annotations "value" }}</td>
<td>{{ $alert.StartsAt }}</td>
</tr>
{{ end }}
</table>
{{ end }}
六、启动测试
首先启动AlertManager
[root@mydb1 ~]# /usr/local/alertmanager/alertmanager --config.file="/usr/local/alertmanager/alertmanager.yml" --log.level=debug &
然后启动Promethus
[root@mydb1 ~]# /usr/local/prometheus/prometheus --config.file=/usr/local/prometheus/prometheus.yml --storage.tsdb.path="/data/prometheus" --storage.tsdb.retention=30d &
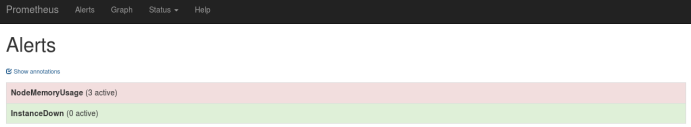
登陆平台查看
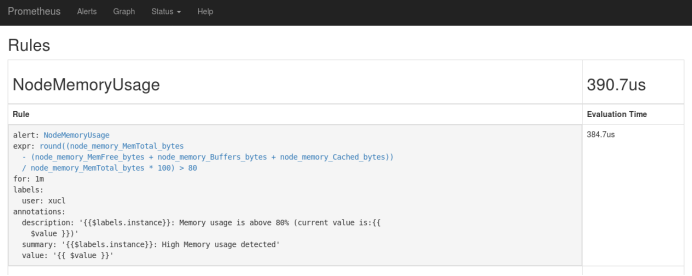
报警规则已经生效
再看报警
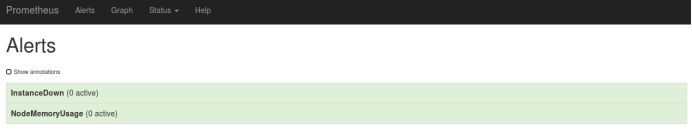
调低阈值,查看是否收到报警邮件
https://juejin.im/post/5b8a659bf265da431e7b947e
prometheus 监控学习
https://songjiayang.gitbooks.io/prometheus/content/
Prometheus 实战
https://www.cnblogs.com/xiaobaozi-95/p/10684524.html
prometheus数据上报方式-pushgateway
https://blog.csdn.net/wuxiaobingandbob/article/details/78954406
使用Prometheus+Grafana监控MySQL实践