在一个微服务体系中,对于应用之间的通信、接口调用如何做到跟踪和监控,一直是一个比较难的问题。
比如A是做商品服务开发的,而B是做订单服务开发的,B在下单的时候需要调用到商品服务的查询商品库存接
口和查询商品明细接口,才能够完成下单流程。现在出现的问题就是下单很慢,要耗时20s。多么恐怖的耗时,
我一个用户,真金白银买你的东西,你却半天不让我下单成功,不想卖直说好吧。
看到没有,在这个过程中,就算最终能够下单成功,也避免不了用户对商家的抱怨与不满,要是多来几次,
你就永远的失去这个客户了。所以老板命令B必须找出原因,为什么下个单这么慢?B最开始想采用打log的方式,
后来发现这样很不科学,订单服务中除了调用商品服务还要调用积分服务,用户服务等等,所以为了尽可能对代
码改动小而又能够准确定位各个服务间调用存在的问题,B选择了使用分布式追踪系统(distributed tracing system)。
SpringCloud提供了组件Sleuth,该组件实现了分布式追踪解决方案,具体是个什么东西,可以参考官网描述:
Spring Cloud Sleuth implements a distributed tracing solution for Spring Cloud, borrowing heavily from Dapper, Zipkin
and HTrace. For most users Sleuth should be invisible, and all your interactions with external systems should be
instrumented automatically. You can capture data simply in logs, or by sending it to a remote collector service.
简单来说就是Sleuth实现了一个分布式追踪解决方案,其中大量借鉴了Dapper,Zipkin等成熟分布式追踪系统。对于用户来说
Sleuth本身是不可见的,我们可以在日志或者远程收集器上看到追踪记录。
这里我们重点需要知道的是,Sleuth本身是不可见的,我们如果想要具体的追踪记录需要到日志或者一些分布式追踪系统(比如Zipkin)
中去查看,这里我使用的是Zipkin。Zipkin又是个啥玩意儿?
Zipkin is a distributed tracing system. It helps gather timing data needed to troubleshoot latency problems in service architectures.
Features include both the collection and lookup of this data.
If you have a trace ID in a log file, you can jump directly to it. Otherwise, you can query based on attributes such as service,
operation name, tags and duration. Some interesting data will be summarized for you, such as the percentage of time spent
in a service, and whether or not operations failed.
Zipkin最重要的特征就是collect和lookup,可以帮助我们收集应用发来的span(span是指一个跨度,如order调用product接口,
这个过程就是一个跨度)并提供UI界面展示查找这些记录。这样我们就可以很方便的定位问题。
接下来看下如何使用Sleuth和Zipkin吧!
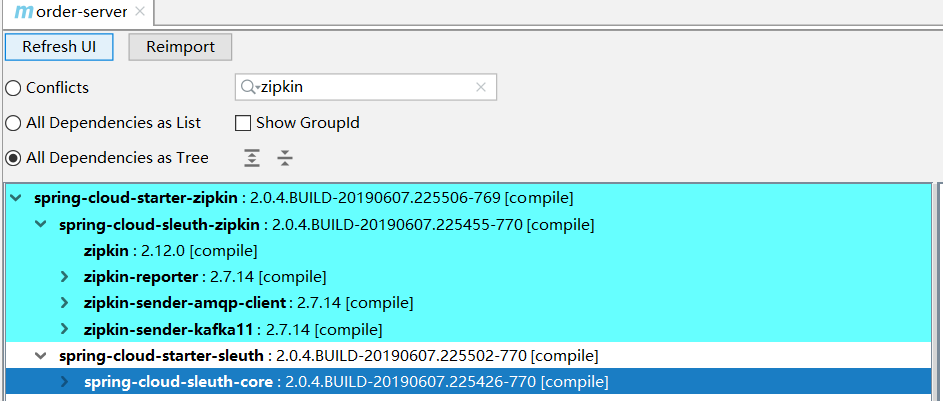
引入依赖
<!--包含sleuth和zipkin-->
        <dependency>
            <groupId>org.springframework.cloud</groupId>
            <artifactId>spring-cloud-starter-zipkin</artifactId>
        </dependency>
这个依赖同时包含了sleuth和zipkin
调整日志级别
logging:
  level:
    root: INFO
    org.springframework.web.servlet.DispatcherServlet: DEBUG
    org.springframework.cloud.sleuth: DEBUG
下载Zipkin
先去官网看下下载方式
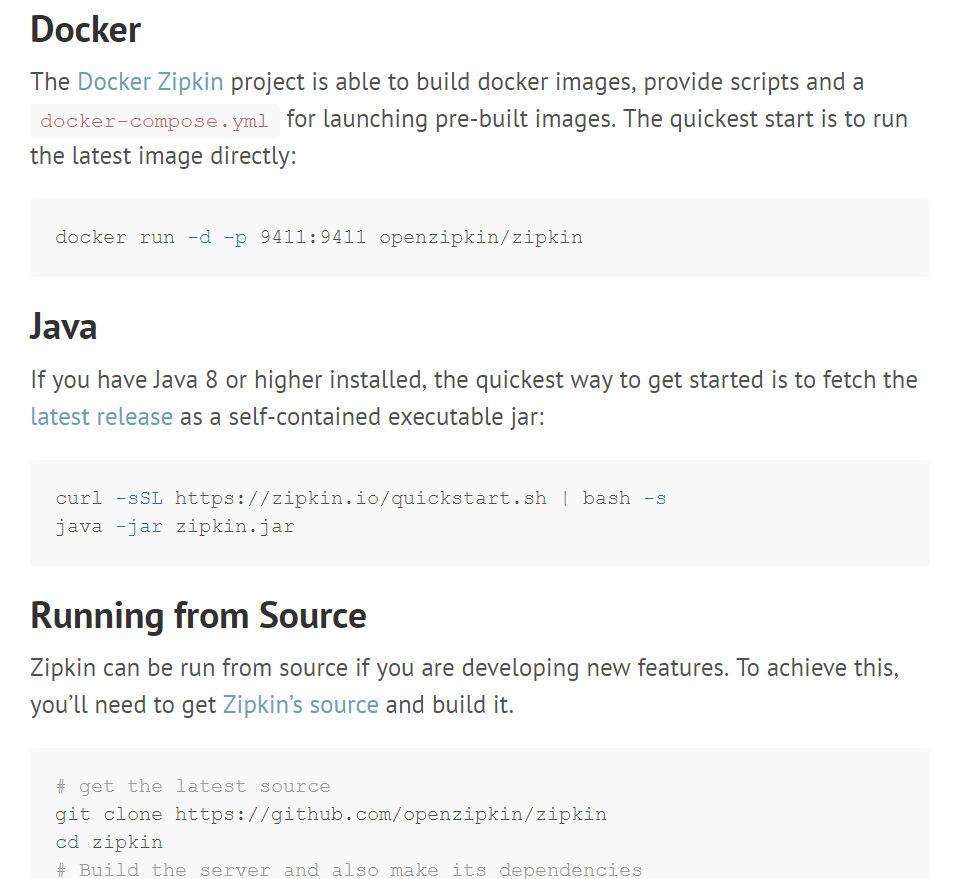
最方便的,用docker下载安装,在安装了docker的机器上执行
docker run -d -p 9411:9411 openzipkin/zipkin
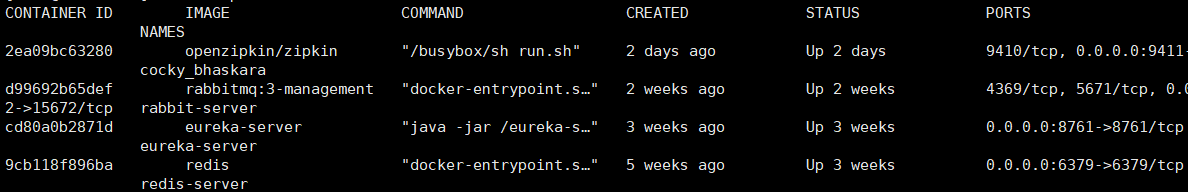
docker ps查看一下进程起没起来
然后在应用里面配置zipkin地址
zipkin:
    base-url: http://localhost:9411/
    sender:
      type: web
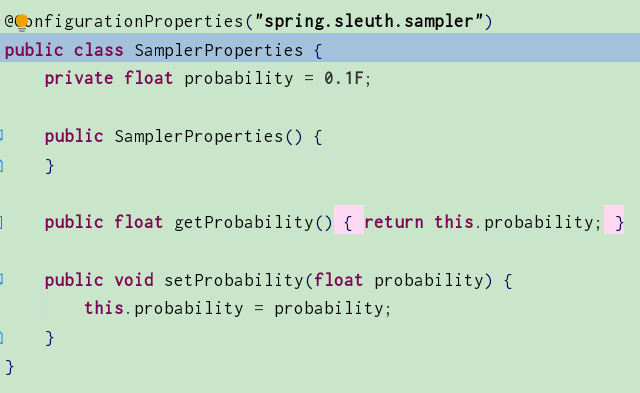
再配置一下sleuth的抽样比例
sleuth:
    sampler:
      probability: 1
抽样比例是什么意思呢?比如我配置成0.1,那么就是每10个服务间的调用,会有一个的追踪记录被发送到zipkin
存储分析,而这里默认值就是0.1,为了演示效果我配置成1,就是所有的服务间调用的记录都会被发送到zipkin上
然后我们启动订单服务和商品服务,访问订单服务,订单服务会调用商品服务,那么理论上就会在日志
和zipkin上看到记录。
先看日志
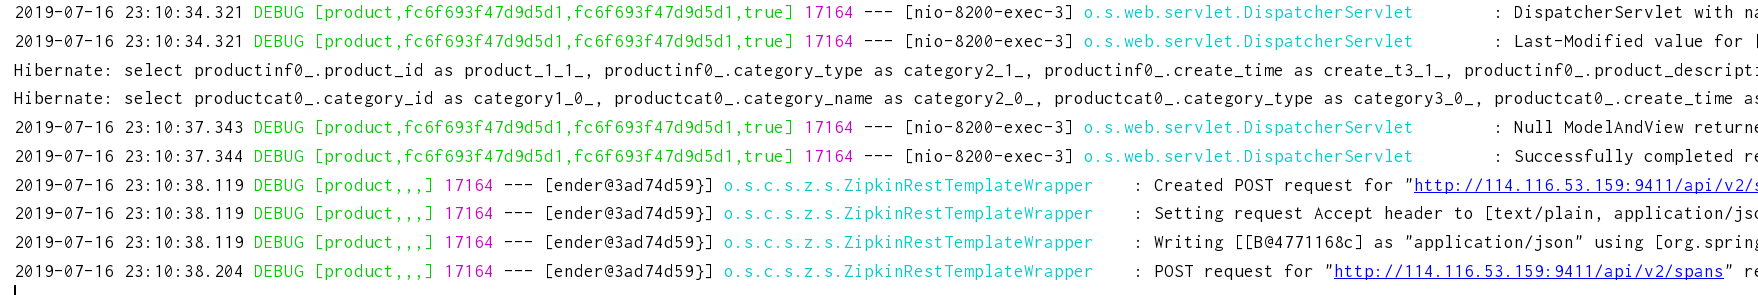
可以看到这里有调用的记录被打出来,格式是这样的:[product,fc6f693f47d9d5d1,fc6f693f47d9d5d1,true]
其中product代表当前的服务,fc6f693f47d9d5d1是traceId,后面的fc6f693f47d9d5d1是spanId,还有个
parentId是可选的,相关的spanId拥有同一个traceId,后面true表示要将span发送到远程服务上去,那我们现在就
可以看下zipkin上有没有相关信息:
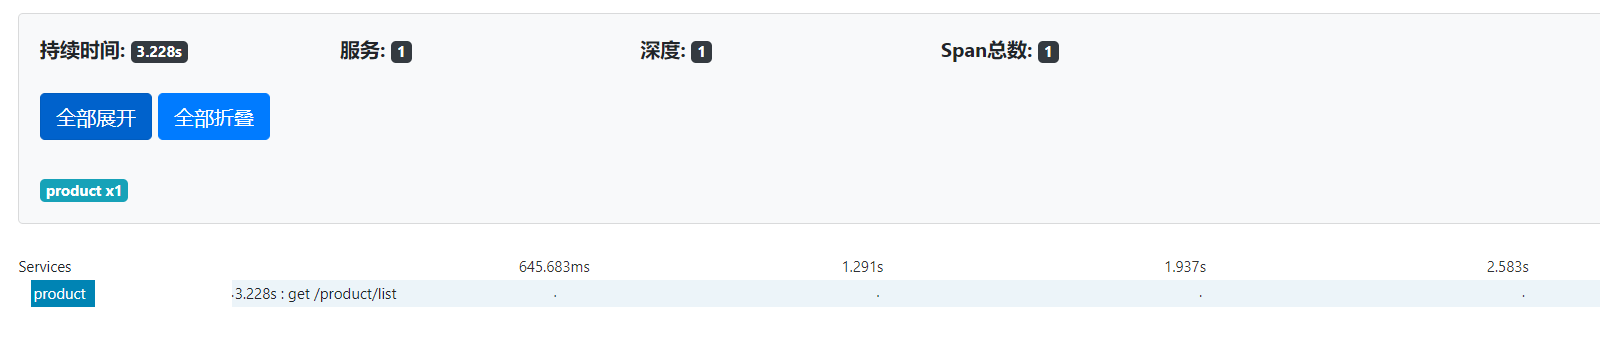
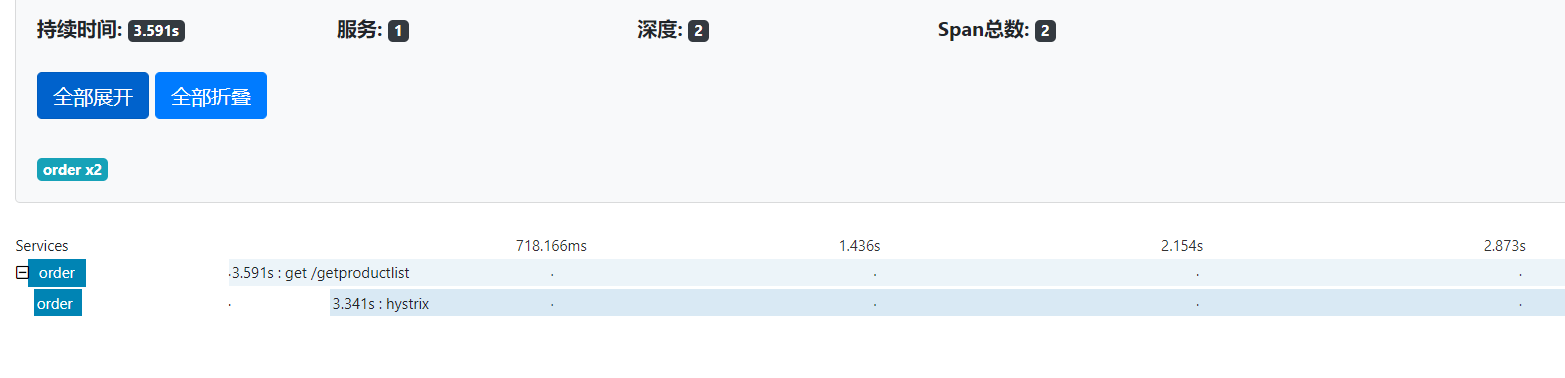
通过查看order和product的追踪记录就可以发现,product的get接口getProductList耗时最久,用了3.228s
这就是一个分布式服务追踪系统的基本功能了。除了这些,还有更多高级功能等待你去使用,参考下面的链接去看看吧:
https://spring.io/projects/spring-cloud-sleuth
本文到此结束,谢谢各位看官阅读!