https://blog.csdn.net/weixin_42032429/article/details/83095899
https://www.cnblogs.com/chenlu-vera/p/9334142.html
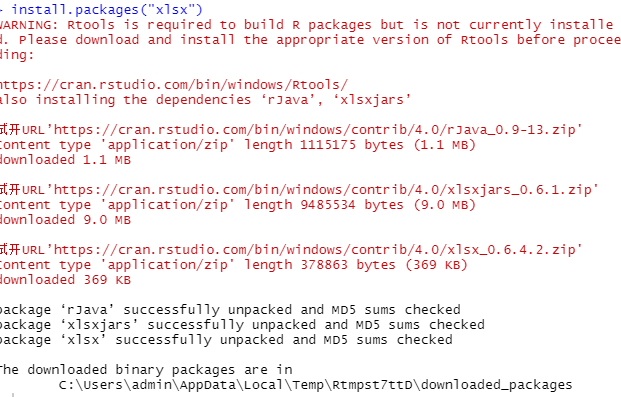
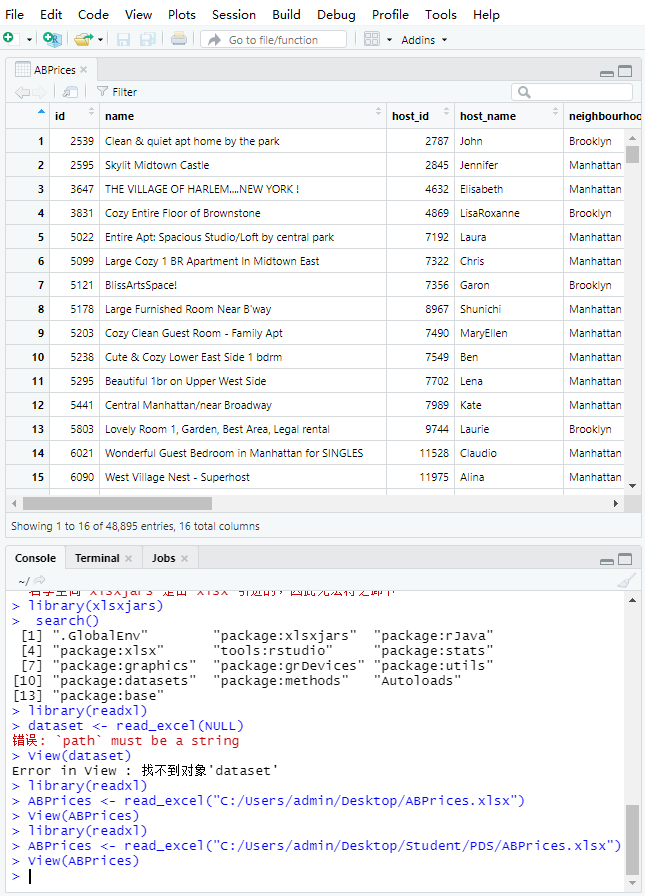
install.packages("rJava")
install.packages("xlsxjars")
install.packages("xlsx")
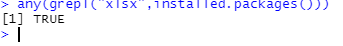
any(grepl("xlsx",installed.packages()))
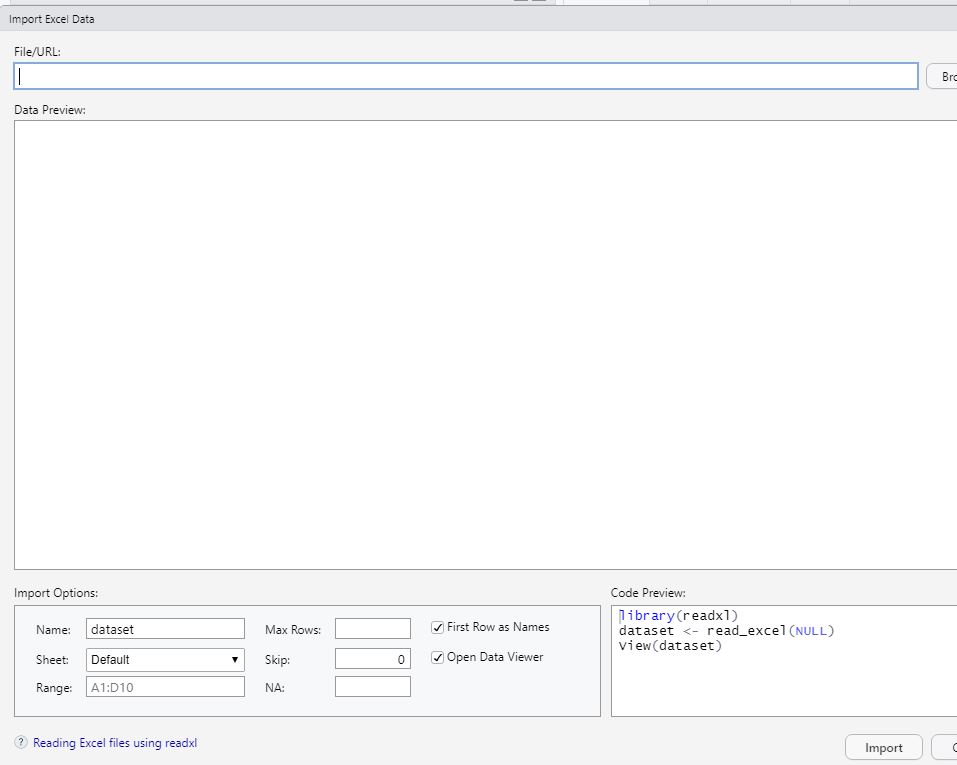
library("xlsx")
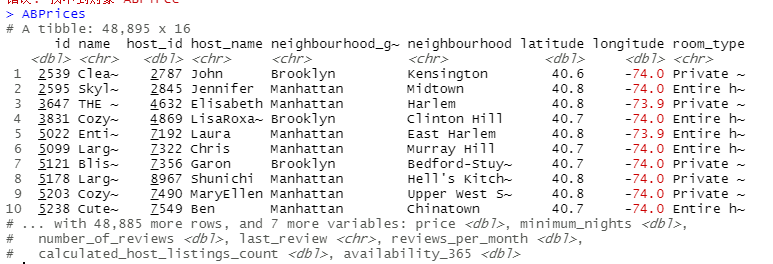
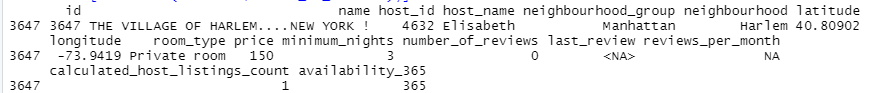
ABPrices
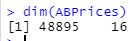
dim(ABPrices)
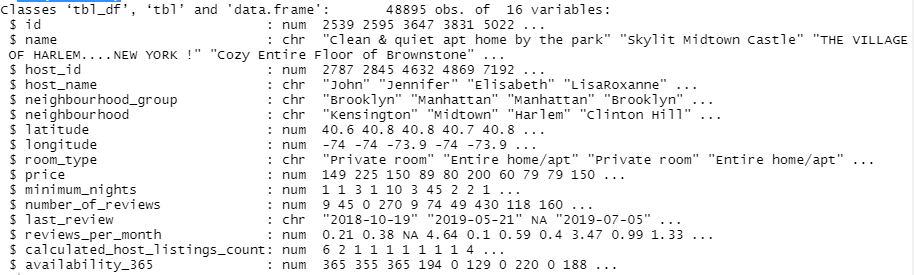
str(ABPrices)
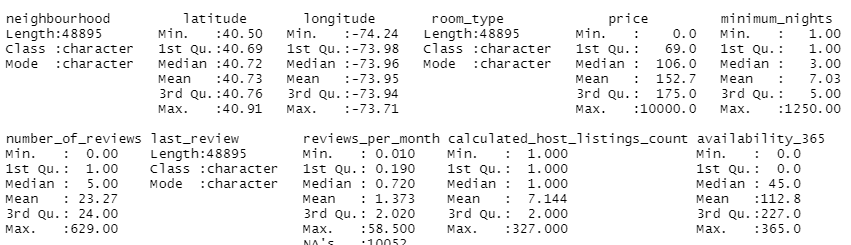
summary(ABPrices)
sum(is.na(ABPrices))

rownames(ABPrices)=ABPrices$id
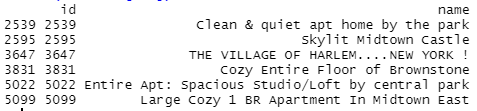
head(ABPrices)
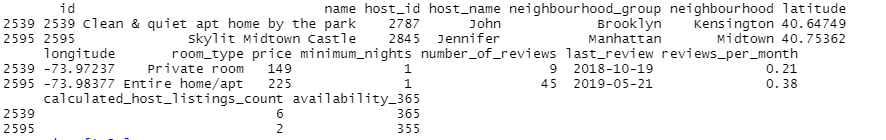
ABPrices[1:2,]
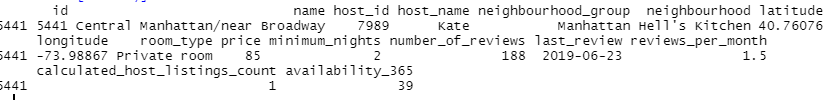
ABPrices['5441']
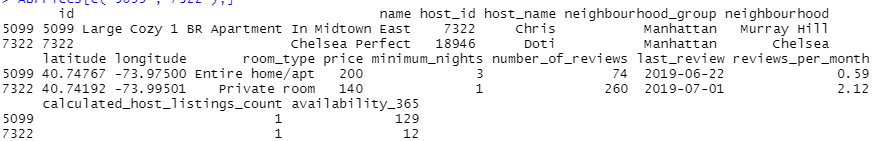
ABPrices[c('5099','7322'),]
head(ABPrices[1:2])
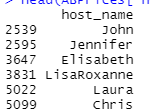
head(ABPrices['host_name'])
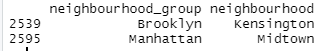
ABPrices[1:2,5:6]
ABPrices['7322','host_name']
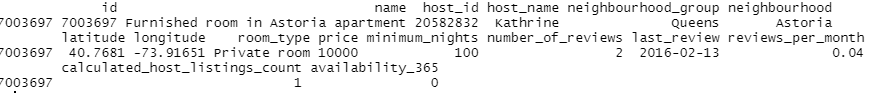
ABPrices[which.max(ABPrices$price),]
ABPrices[which.min(ABPrices$number_of_reviews),]
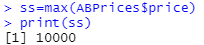
ss=min(ABPrices$price)
print(ss)
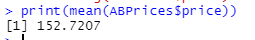
print(mean(ABPrices$price))
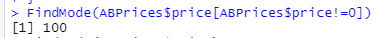
(18)去除0值后找到房租金额平均值
print(mean(ABPrices$price[ABPrices$price!=0]))

(19)计算众数
自定义函数
FindMode <- function(x) {
    ux <- unique(x)
    ux[which.max(tabulate(match(x, ux)))]
}
使用函数
FindMode(ABPrices$price[ABPrices$price!=0])
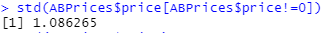
(20)标准误差
标准偏差除以样本大小的平方根
std <- function(x) sd(x)/sqrt(length(x))
调用
std(ABPrices$price[ABPrices$price!=0])
(21)标准差
sd(ABPrices$price[ABPrices$price!=0])
(22)方差
var(ABPrices$price[ABPrices$price!=0])
(23)计算偏度和峰度
mean(((newPrice-mean(newPrice))/sd(newPrice))^3)
或者
install.packages("EnvStats")
library("EnvStats")
skewness(x) #EnvStats包中计算偏度系数函数
kurtosis(x) #EnvStats包中计算峰度系数函数
(24)统计房产数量最多的房屋主
建立表格,使用table函数统计host_id出现次数,并将host_id与频率组合为一张表
freq <- data.frame(table(ABPrices$host_id))
将该表的统计数组剥离出来按照由大到小排序
tmp[order(tmp,decreasing = TRUE)]
并赋值给新数组
tmp2<-tmp[order(tmp,decreasing = TRUE)]
根据房屋数量输出对应host_id
freq$Var1[freq$Freq==tmp2[1]]
中位数
median(x, na.rm = FALSE)
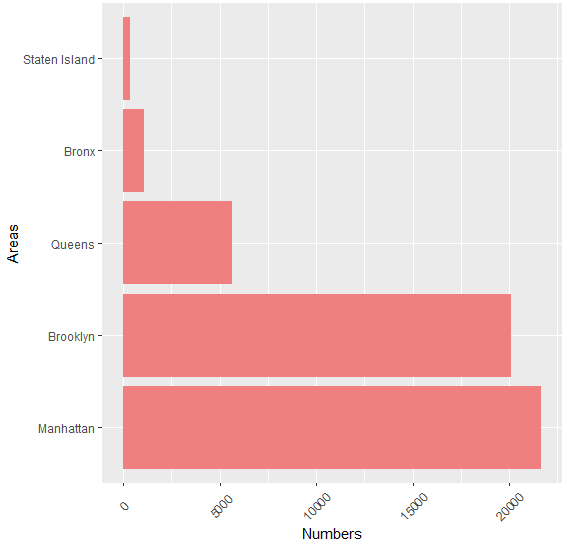
#下载依赖包
install.packages("dplyr")
install.packages("ggplot2")

#加载依赖包
library(dplyr)
library(ggplot2)

#统计各区住房数量
freq <- data.frame(table(ABPrices$neighbourhood_group))

plot <- ggplot(data = freq, mapping = aes(x = reorder(Var1, -Freq),y = Freq)) + geom_bar(stat = 'identity', fill = 'lightcoral') + theme(axis.text.x  = element_text(angle = 45, vjust = 0.5)) + xlab('Areas') + ylab('Numbers')+ coord_flip()

plot
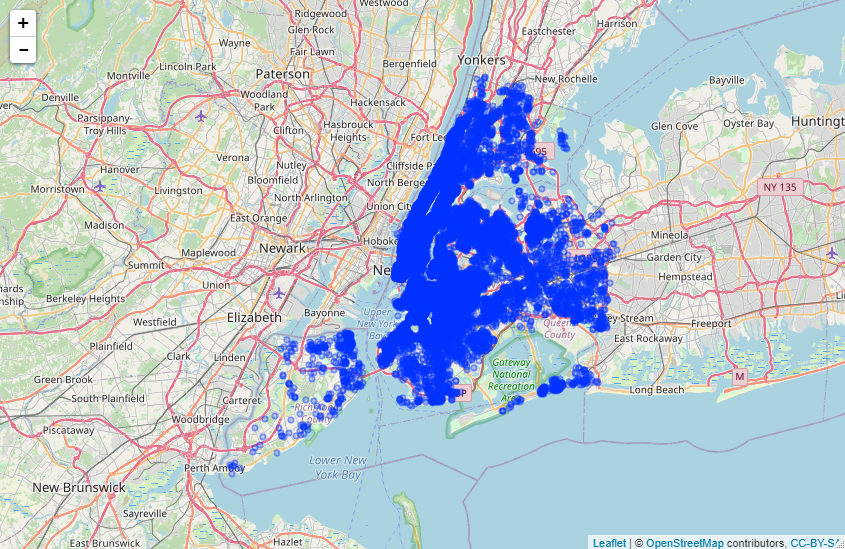
(2)显示地图上的点
使用leaflet地图包
install.packages("leaflet")
library("leaflet")
添加标记点
 df = data.frame(
     lat = ABPrices$latitude,
     lng = ABPrices$longitude,
     size = 1
 )
 m<-leaflet(data=df)
 m<-addTiles(m)
 addCircleMarkers(m,lng=~lng,lat=~lat,radius = ~size, fill = TRUE)