压测环境
- k8s容器环境
- 单核
- 32GB内存
- thanos版本:v0.22.0
- 客户端发送32271959条数据,100个并发;同样的数据文件发送了两遍,取第二遍的性能数据
- 在thanos receiver CPU占用100%的情况下观察其表现
- 持续时间:14:29~15:03,33分钟
压测详细数据
1.请求曲线:
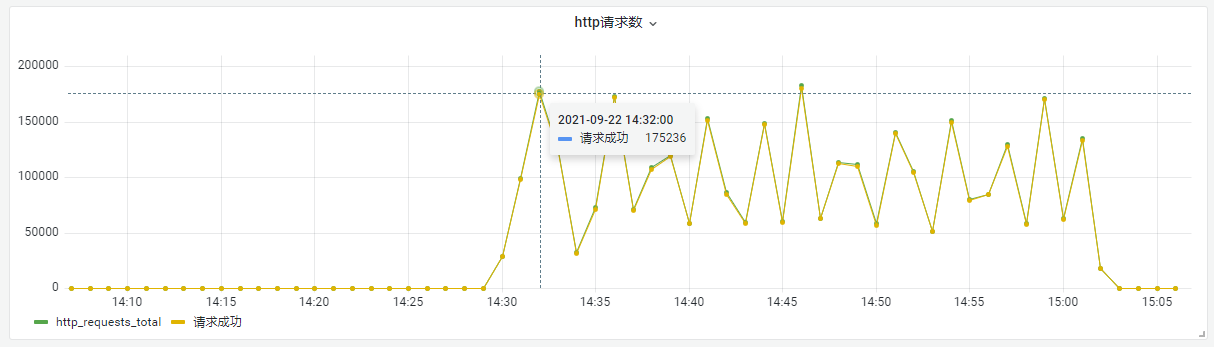
查询表达式:sum by (instance) (rate(http_requests_total{handler="receive",method="post",instance="$instance",code="200"}[1m]))*60
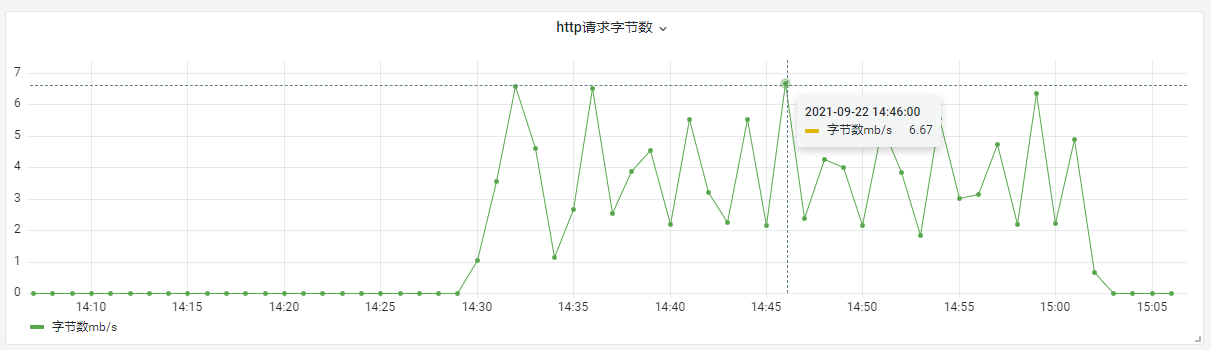
查询表达式:sum by () (rate(http_request_size_bytes_sum{instance="$instance"}[1m])/1024/1024)

查询表达式:sum by (code) (rate(http_requests_total{handler="receive",method="post",instance="$instance",code!="200"}[1m]))*60
2.资源情况

查询表达式:sum by (instance) (rate(process_cpu_seconds_total{instance="$instance"}[1m]))*60
查询表达式:
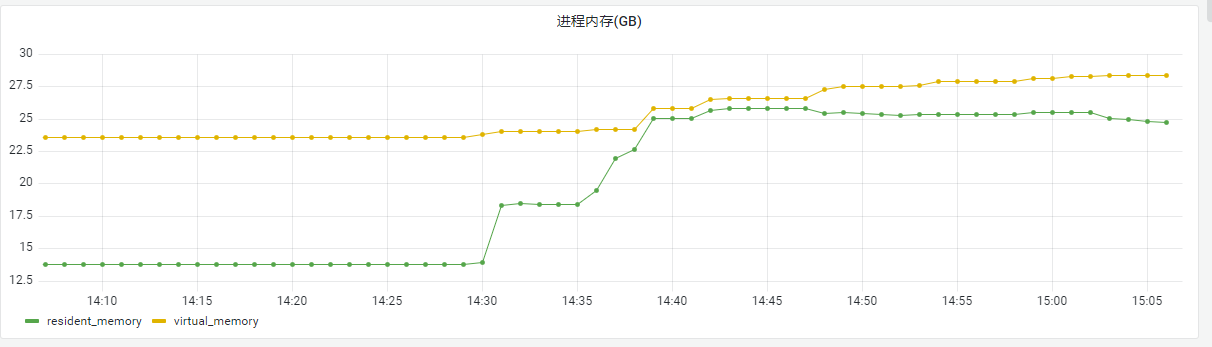
- 物理内存:
sum by (instance) (max_over_time(process_resident_memory_bytes{instance="$instance"}[1m]))/1024/1024/1024- 物理内存峰值:25.9GB
- 压测前的物理内存:13.8GB,内存上涨12.1GB
- 虚拟内存:
sum by (instance) (max_over_time(process_virtual_memory_bytes{instance="$instance"}[1m]))/1024/1024/1024 - thanos receiver的内存,并没有因为切换tsdb而明显的降低,没有请求后,内存释放得非常缓慢:
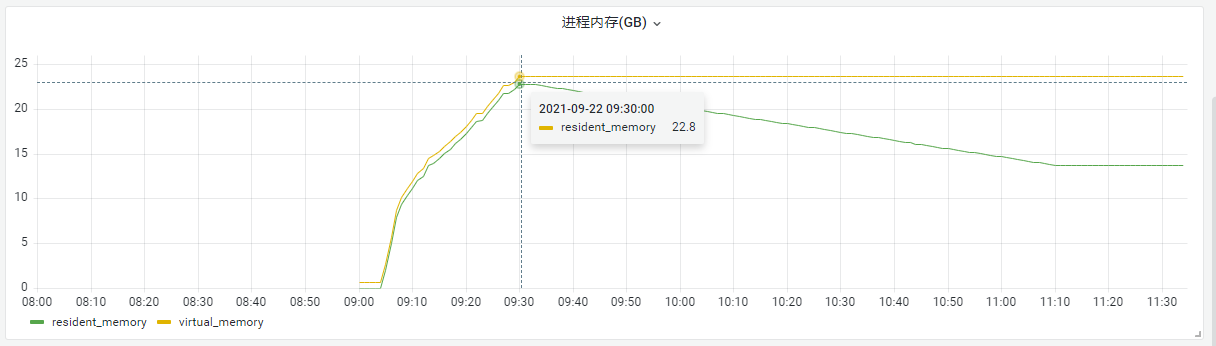
- 从9:30~11:09,共100分钟内,内存从22.8GB减少到13.8GB,减少了9GB
3.sample情况
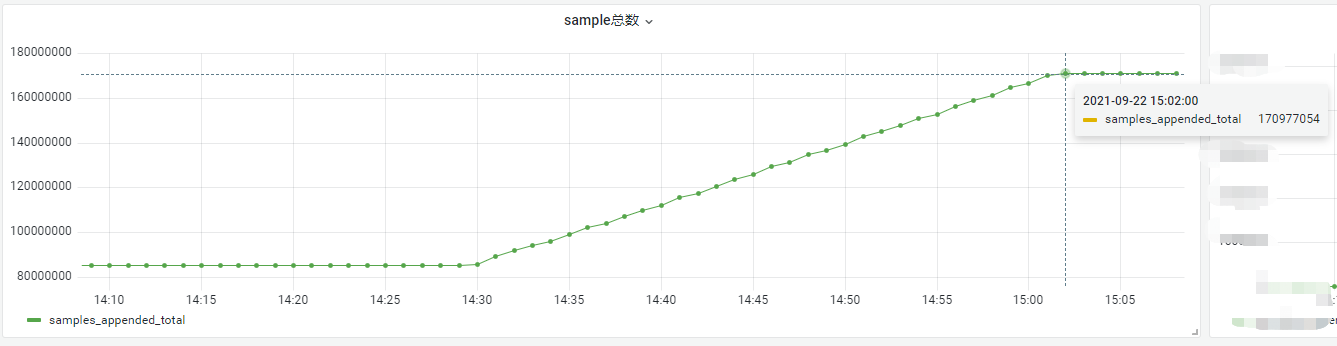
查询表达式:prometheus_tsdb_head_samples_appended_total{instance="$instance"}
- 新增data point 85490118,平均 2590610/min, 43177/s
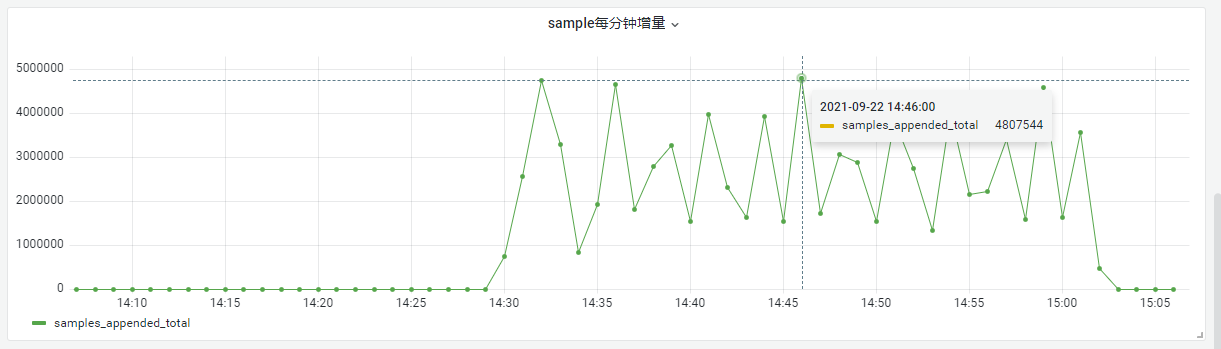
查询表达式:sum by () (rate(prometheus_tsdb_head_samples_appended_total{instance="$instance"}[1m]))*60 - 峰值:4807544/min, 80126/s,可以认为thanos receiver单核的极限的处理data point的能力为8万每秒。
4. time series情况:
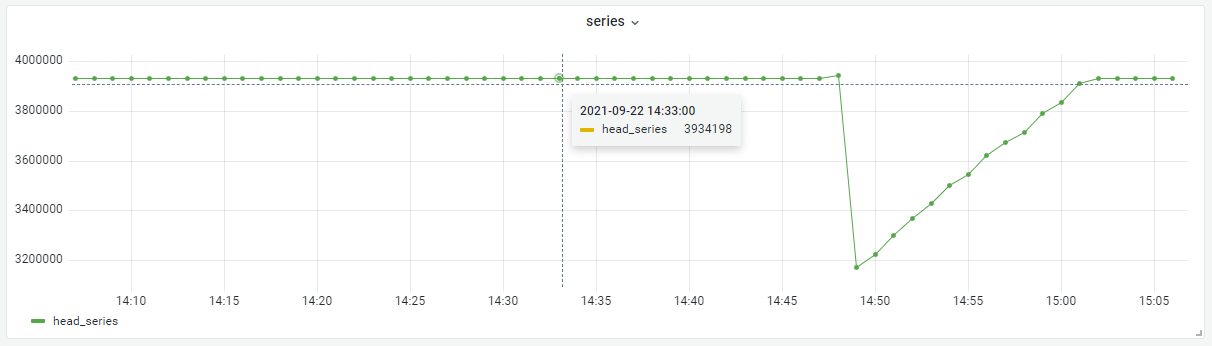
查询表达式:prometheus_tsdb_head_series{instance="$instance"}
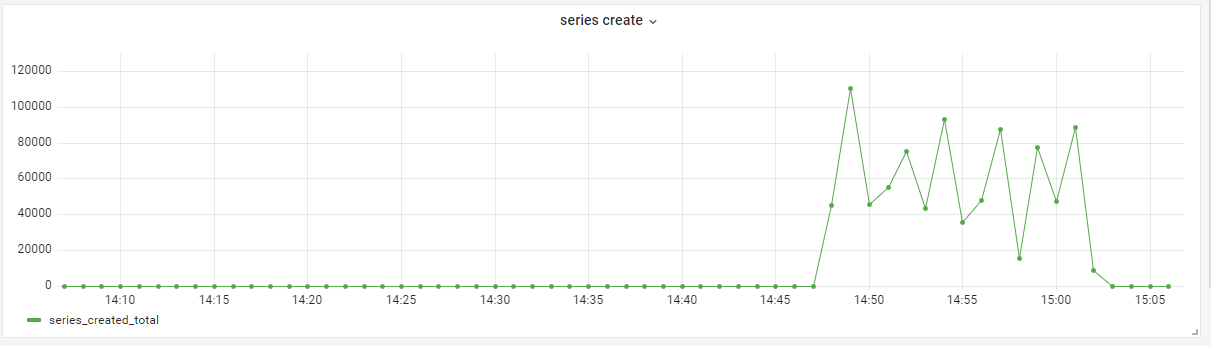
查询表达式:sum by () (rate(prometheus_tsdb_head_series_created_total{instance="$instance"}[1m]))*60
- 因为同样的数据文件发送了两次,所以time series的总数是一致的;time series总数达到 3934198
- 平均每个time series有 85490118 / 3934198 = 21.7 个data point(sample)
5. chunk情况:
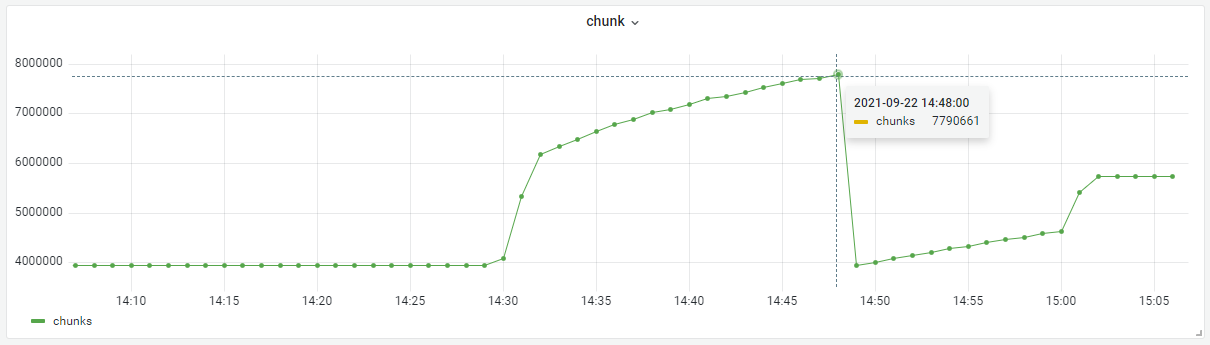
查询表达式:prometheus_tsdb_head_chunks{instance="$instance"}
- tsdb的两个参数:
"--tsdb.min-block-duration=30m","--tsdb.max-block-duration=30m",因此14:29~14:49达到了tsdb切换的周期

查询表达式:sum by () (rate(prometheus_tsdb_head_chunks_created_total{instance="$instance"}[1m]))*60
6.其他
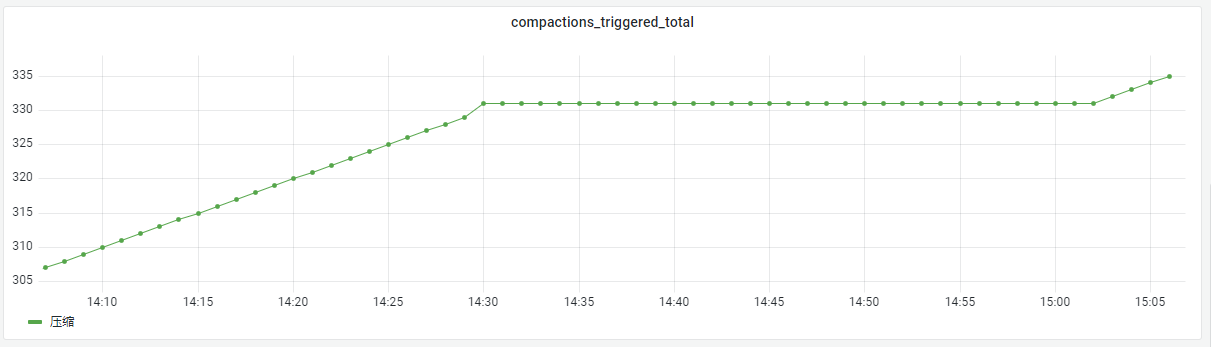
查询表达式:prometheus_tsdb_compactions_triggered_total{instance="$instance"}
- 为什么只在没有请求的时候触发 compaction ?
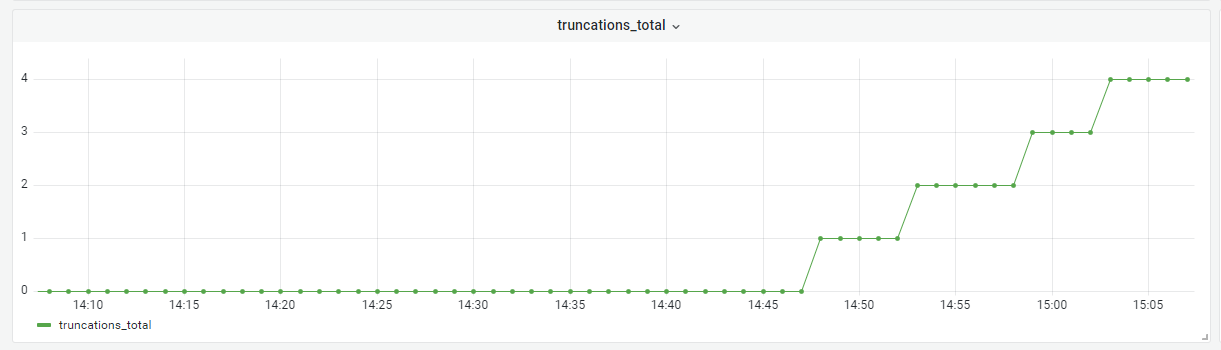
查询表达式:prometheus_tsdb_head_truncations_total{instance="$instance"} - truncate动作的执行规律,还没搞明白
结论
- thanos receiver单核处理data point的能力大约在 43177/s ~ 80126/s
- 粗略的认为:存储 3934198 time series + 85490118个data point花费了12.1GB内存