1、前言
聚类分析是机器学习和数据分析中非常常见的分类方法,
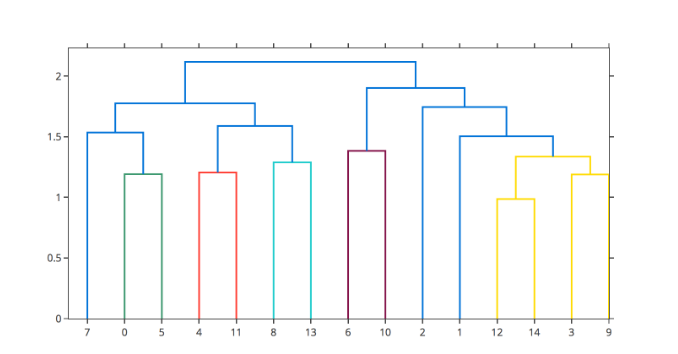
当我们用到层次聚类(系统聚类)时,最常用的分析方法就是绘制树状图,
比较常见的统计软件像SPSS、SAS、R等都可以直接绘制树状图,比较简单,
2、Plotly
python绘制树状图主要介绍使用Plotly工具
2.1首先在python库中引入所需要的plotly包
2.2然后注册plotly生成密钥https://plot.ly/settings/api/
2.3调用密钥
import chart_studio
chart_studio.tools.set_credentials_file(username='你的用户名',
 api_key='你的密钥')
2.4导入数据生成树图
import pandas as pd
import chart_studio.plotly as py
import plotly.figure_factory as ff
import numpy as np
data = pd.read_csv('E:\result.csv',nrows =500,encoding='gbk')
X = data[["类别"]]
fig = ff.create_dendrogram(X, orientation='left',labels=list(data["名称"]))
fig['layout'].update({'width':800, 'height':1500})
py.plot(fig, filename='dendrogram_with_labels')