npm install echarts -S
或者使用淘宝的镜像
npm install -g cnpm --registry=https://registry.npm.taobao.org
cnpm install echarts -S
import echarts from 'echarts'
Vue.prototype.$echarts = echarts
<div class="BrokenLine" id="BrokenLine" ></div>
.BrokenLine {
    display: inline-block;
    min-width: 200px;
    height: 400px;
    width: 50%;
  }
methods: {
DoEchart() {
// 这里我是部分引入,用哪种图就引入哪种,也可以全部引入
var echarts = require('echarts/lib/echarts');
// 引入柱状图
require('echarts/lib/chart/bar');
// 引入提示框和标题组件
require('echarts/lib/component/tooltip');
require('echarts/lib/component/title');
var BrokenLine = echarts.init(document.getElementById('BrokenLine'));
// 绘制图表
BrokenLine.setOption({
title: {
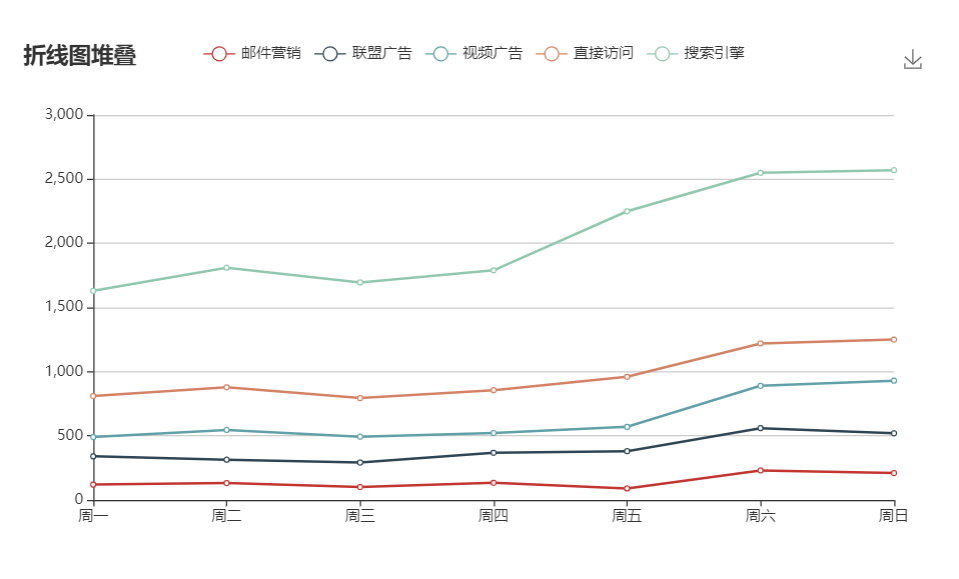
text: '折线图堆叠'
},
tooltip: {
trigger: 'axis'
},
legend: {
data: ['邮件营销', '联盟广告', '视频广告', '直接访问', '搜索引擎']
},
grid: {
left: '3%',
right: '4%',
bottom: '3%',
containLabel: true
},
toolbox: {
feature: {
saveAsImage: {}
}
},
xAxis: {
type: 'category',
boundaryGap: false,
data: ['周一', '周二', '周三', '周四', '周五', '周六', '周日']
},
yAxis: {
type: 'value'
},
series: [{
name: '邮件营销',
type: 'line',
stack: '总量',
data: [120, 132, 101, 134, 90, 230, 210]
},
{
name: '联盟广告',
type: 'line',
stack: '总量',
data: [220, 182, 191, 234, 290, 330, 310]
},
{
name: '视频广告',
type: 'line',
stack: '总量',
data: [150, 232, 201, 154, 190, 330, 410]
},
{
name: '直接访问',
type: 'line',
stack: '总量',
data: [320, 332, 301, 334, 390, 330, 320]
},
{
name: '搜索引擎',
type: 'line',
stack: '总量',
data: [820, 932, 901, 934, 1290, 1330, 1320]
}
]
});
}
}
 mounted() {
    this.DoEchart();
 }