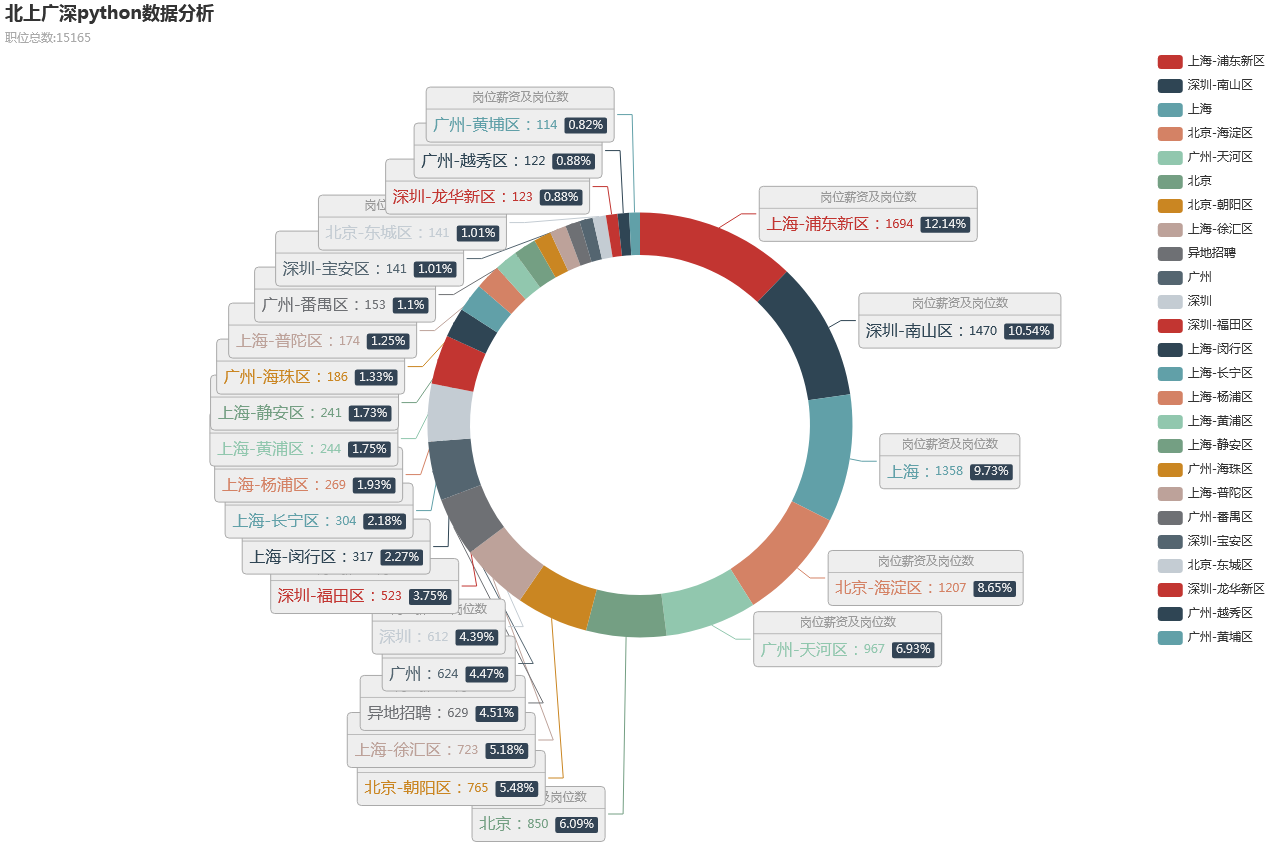
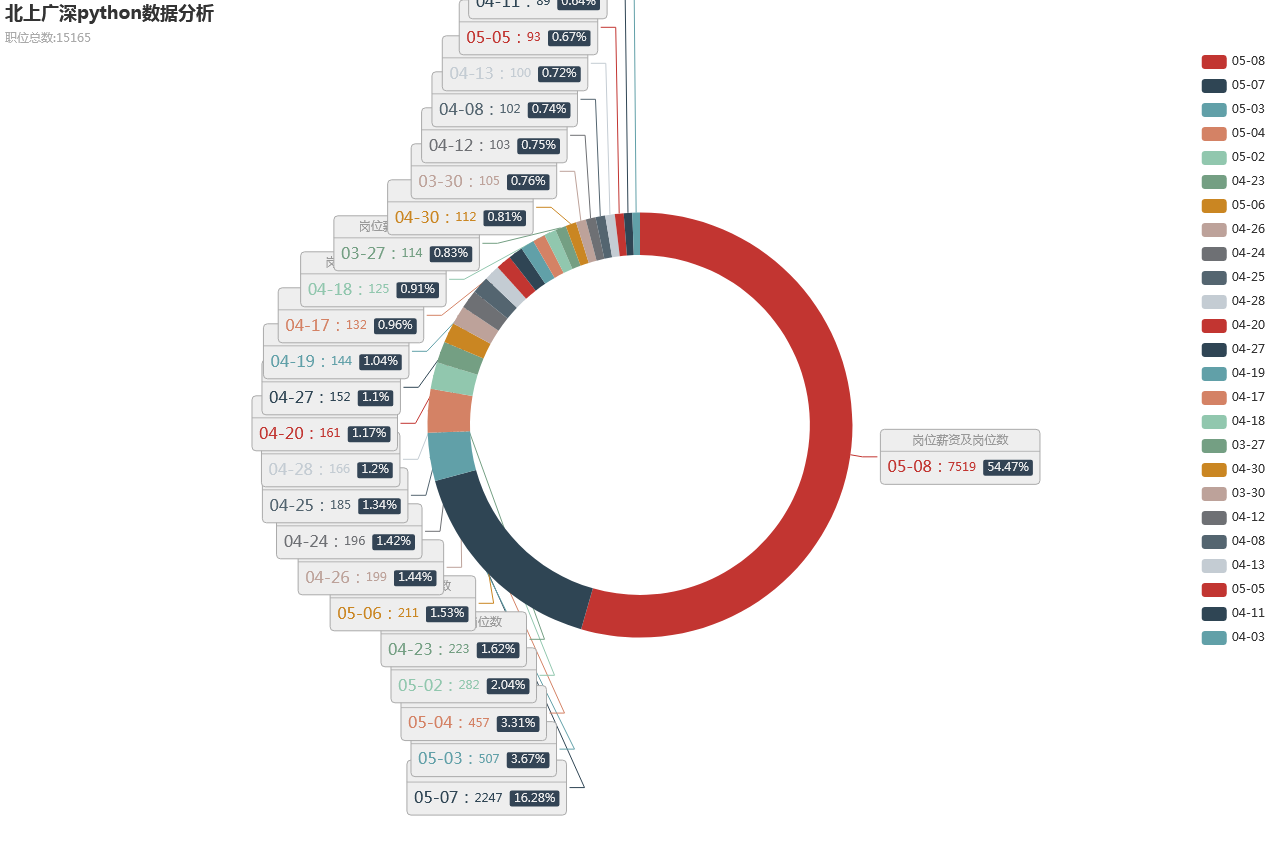
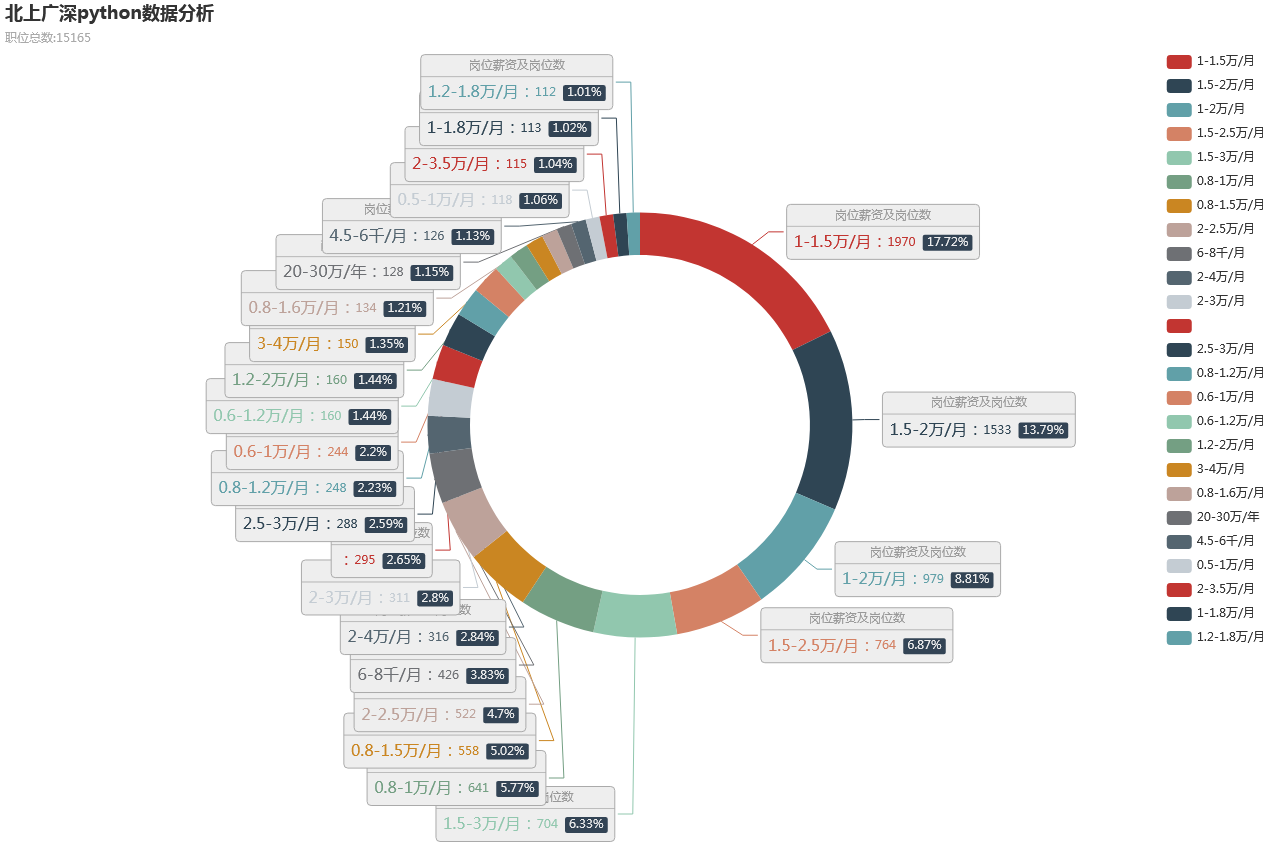
1 基于Echars图表数据分析(HTML部分:创建div-->调用js)


{% for main in main_count %}
    <div id="{{ main|safe }}" style="1280px;height:850px;"></div>
{% endfor %}

<script type="text/javascript">
    var i = 0;
    getId = function () {
        return i++;
    };
    var j = 0;
    getIdj = function () {
        return j++;
    };
    //get_jobname = function (i){
    //    var name = new Array();
    //   name={{ jobname|safe }};
    //return name[i];
    //};
    window.onload=function(){
        {% for tmp_one in data_pie %}
            pie_js({{ tmp_one|safe }},getId());
        {% endfor %}
    }
</script>
2 js部分(接收后台传递的数据前端显示渲染)
function pie_js(data,main){
    var myChart = echarts.init(document.getElementById(main));
    var option = {
        title: {
            text: data[0]+'数据分析',
            subtext:'职位总数:'+data[1]
        },
        tooltip : {
            trigger: 'item',
            formatter: "{a} <br/>{b}: {c} ({d}%)"
        },
        legend: {
            type: 'scroll',
            orient: 'vertical',
            right: 10,
            top: 50,
            bottom: 20,
            data: data[2]
        },

        grid: {
            left: '3%',
            right: '4%',
            bottom: '3%',
            containLabel: true
        },
        toolbox: {
            feature: {
                saveAsImage: {},
                dataView : {show: true, readOnly: false},
                magicType : {show: true, type: ['line', 'bar']},
                restore : {show: true},
            }
        },
        series: [
            {
                name: '访问来源',
                type: 'pie',
                radius: ['40%', '50%'],
                label: {
                    normal: {
                        formatter: '{a|{a}}{abg|}
{hr|}
  {b|{b}:}{c}  {per|{d}%}  ',
                        backgroundColor: '#eee',
                        borderColor: '#aaa',
                        borderWidth: 1,
                        borderRadius: 4,

                        rich: {
                            a: {
                                color: '#999',
                                lineHeight: 22,
                                align: 'center'
                            },

                            hr: {
                                borderColor: '#aaa',
                                 '100%',
                                borderWidth: 0.5,
                                height: 0
                            },
                            b: {
                                fontSize: 16,
                                lineHeight: 33
                            },
                            per: {
                                color: '#eee',
                                backgroundColor: '#334455',
                                padding: [2, 4],
                                borderRadius: 2
                            }
                        }
                    }
                },
                name: '岗位薪资及岗位数',
                type: 'pie',
                data: data[4]
            }
        ]
    };
    // 使用刚指定的配置项和数据显示图表
    myChart.setOption(option);
}
3 Django后台从数据库查询数据传递数据至html
return render(request,'echartapp/PieAnalysis.html',
                  {
                      'hist_sort':hist_sort,
                      'jobname':jobname_key,
                      'main_count':len_jobname,
                      'data_pie':all_data,
                  }
                  )
备注:
【1】往js传递参数需在<script>内部先定义:var address ={{ address|safe}};
【2】循环传递数据变量需在<script>内部先定义函数:pie_js({{ tmp_one|safe }},getId());
【3】计数功能
hist = {}
    for word in jobname_list:
        if word not in hist:  # 生成列表并统计个数
            hist[word] = 1
        else:
            hist[word] = hist[word] + 1
    # 字典排序[('BJJSZC', 17402), ('WHJSZC', 8799), ('python_BJ', 145), ('python_WH', 49)]
    hist_sort = sorted(hist.items(), key=lambda x: x[1], reverse=True)
++++++++++++++++++++++++++++++++++++++++++