matlab绘制条形图并分组显示:
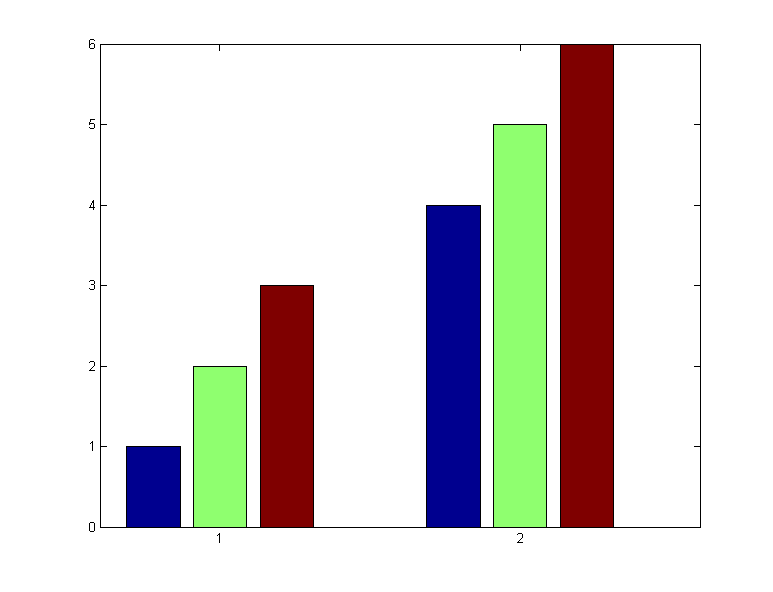
a =[1 2 3]
b =[4 5 6]
>> d=[a;b]
d =
1 2 3
4 5 6
>> bar(d,'group')
修改横坐标的值为:
>>set(gca,'xticklabel',1:2:5)

为坐标轴添加说明:菜单Edit->Axes Properties->找到X Axis/Y Axis,->在 X Label/Y Label输入即可。


或者菜单Insert->X Label/Y Label
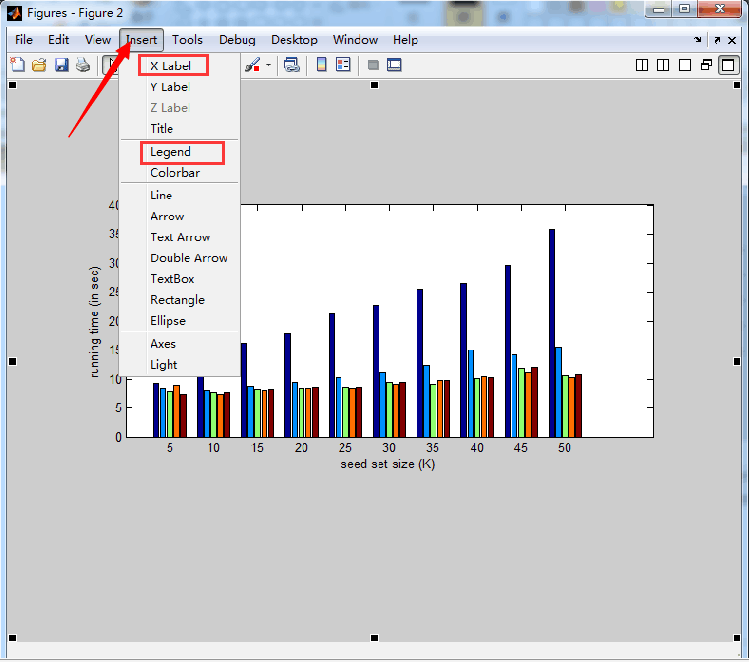
添加图例:菜单Insert->Legend

参考:
http://jingyan.baidu.com/article/64d05a02524e63de54f73b76.html