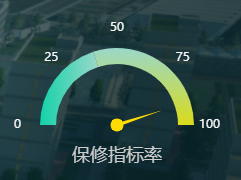
echarts-仪表盘-渐变

效果图:

  <div style=" 244px; height: 220px" id="propertyRightBottom"></div>
 // 自适应字体大小变化
    WidthAdaptive(res) {
      var windth = window.innerWidth;
      let fontSize = windth / 1920;
      return fontSize * res;
    },
    drawLine() {
      // 基于准备好的dom,初始化echarts实例
      let myChart = this.$echarts.init(
        document.getElementById("propertyRightBottom")
      );

      let option = {
        backgroundColor: "transparent",
        grid: {
          right: "5%",
          left: "5%",
          top: "10%",
          bottom: "5%",
          borderWidth: 1,
        },
        xAxis: {
          show: false,
          type: "category",
          data: ["Mon"],
        },
        yAxis: {
          show: false,
          type: "value",
        },
        series: [
          {
            name: "任务完成率",
            type: "gauge",
            center: ["50%", "80%"],
            radius: "70%",
            min: 0,
            max: 100,
            splitNumber: 4,
            startAngle: 180,
            endAngle: 0,
            zlevel: 0,
            z: 9,
            data: [
              {
                value: 90,
                name: "保修指标率",
                itemStyle: {
                  color: "#FFDD01",
                },
              },
            ],
            detail: {
              formatter: function (params) {
                return "保修指标率";
              },
              fontSize: 18,
              color: "#ccc",
            },
            legend: {
              padding: 0,
              margin: 0,
            },
            pointer: {
              show: true,
              length: "60%",
              radius: "50%",
               "2.5%", //指针粗细
            },
            title: {
              // 仪表盘标题。
              show: false, // 是否显示标题,默认 true。
            },
            markLine: {
              precision: 2,
            },
            axisTick: {
              show: false,
              splitNumber: 4,
              lineStyle: {
                 2,
              },
              length: -8,
            }, //刻度样式
            splitLine: {
              show: true,
              length: -6,
              lineStyle: {
                color: "transparent", //用颜色渐变函数不起作用
              },
            }, //分隔线样式
            axisLabel: {
              show: true,
              color: "#f9f9f9",
              distance: -20,
            },
            axisLine: {
              // 坐标轴线
              lineStyle: {
                // 属性lineStyle控制线条样式
                 16, // 仪表盘宽度
                color: [
                  //             颜色渐变函数 前四个参数分别表示四个位置依次为 右上左下
                  [
                    0,
                    new this.$echarts.graphic.LinearGradient(
                      1,
                      0,
                      0,
                      0,
                      [
                        {
                          offset: 1,
                          color: "#13d2a9", // 0% 处的颜色
                        },
                        {
                          offset: 0,
                          color: "#13d2a9", // 100% 处的颜色
                        },
                      ],
                      false
                    ),
                  ],

                  [
                    0.4,
                    new this.$echarts.graphic.LinearGradient(
                      1,
                      0,
                      0,
                      0,
                      [
                        {
                          offset: 1,
                          color: "#13d2a9", // 0% 处的颜色
                        },
                        {
                          offset: 0,
                          color: "#9ad8c9", // 100% 处的颜色
                        },
                      ],
                      false
                    ),
                  ],

                  [
                    1,
                    new this.$echarts.graphic.LinearGradient(
                      0,
                      1,
                      0,
                      0,
                      [
                        {
                          offset: 1,
                          color: "#9ad8c9", // 0% 处的颜色
                        },
                        {
                          offset: 0,
                          color: "#dadb1b", // 100% 处的颜色
                        },
                      ],
                      false
                    ),
                  ],
                ],
              },
            },
          },
          {
            name: "小圆形",
            type: "pie",
            hoverAnimation: false,
            legendHoverLink: false,
            zlevel: 0,
            center: ["50%", "80%"],
            radius: ["0%", "6%"],
            tooltip: {
              show: false,
            },
            z: 10,
            label: {
              normal: {
                show: false,
                position: "center",
              },
              emphasis: {
                show: false,
              },
            },
            labelLine: {
              normal: {
                show: false,
              },
            },
            data: [
              {
                value: 100,
                name: "2",
                itemStyle: {
                  normal: {
                    color: "#FFDD01",
                  },
                },
              },
            ],
          },
        ],
      };
      window.onresize = function () {
        myChart.resize();
      };
      myChart.setOption(option);
    },
原文地址:https://www.cnblogs.com/a973692898/p/15384628.html